Introduction
Update: I've noticed some strange behavior of SSDs when benchmarking them with FIO. After further investigation and additional testing, I've found the reason for the strange patterns in the graphs.
The 'strange' test results are due to the fact that they were obtained by connecting the SSDs to a P420I controller. As the HBA mode of this controller performs worse than the RAID mode, I used the RAID mode of this controller. Indvidual drives were put in a RAID0 volume. But it turns out that this creates a strange interaction between RAID controller and SSD.
Additional testing with an SATA 300 AHCI controller shows 'normal' patterns that look similar to the results of the INTEL SSD as compared to the other ones (Samsung and Kingston).
It seems I've made a mistake by using the P420i controller for testing. I have includes both 'bad' and 'good' results.
Regular SATA solid state drives may seem interchangeable at this point. They all show amazing IOPS and latency performance.
I have performed benchmarks on different SSDs from different vendors and it seems that they actually show very different behaviour. This behavior has come to light because I benchmarked the entire device capacity.
The benchmark - performed with FIO - puts a fifty percent read/write random 4K workload on the device. The benchmark stops when all sectors of the device have been read or written to. Furthermore, all tests are performed with a queue depth of 1.
I've made this post because I found the results interesting. At least the images show a very peculiar pattern for some SSDs. I can't explain them really, maybe you can.
This is the test I ran against the SSDs.
fio --filename=/dev/sdX --direct=1 --rw=randrw --refill_buffers
--norandommap --ioengine=libaio --bs=4k --rwmixread=50 --iodepth=1
Disclaimer
I've performed these benchmark to the best of my knowledge. The raw benchmark data is available here
It's always possible that I made a mistake, so it may be wise to run your own tests to see if you can replicate these results.
Caveat: I really don't know if these benchmark results impact real-life performance. Maybe these benchmark results show a kind of behaviour of SSDs that doesn't really matter in the end.
Benchmark Results
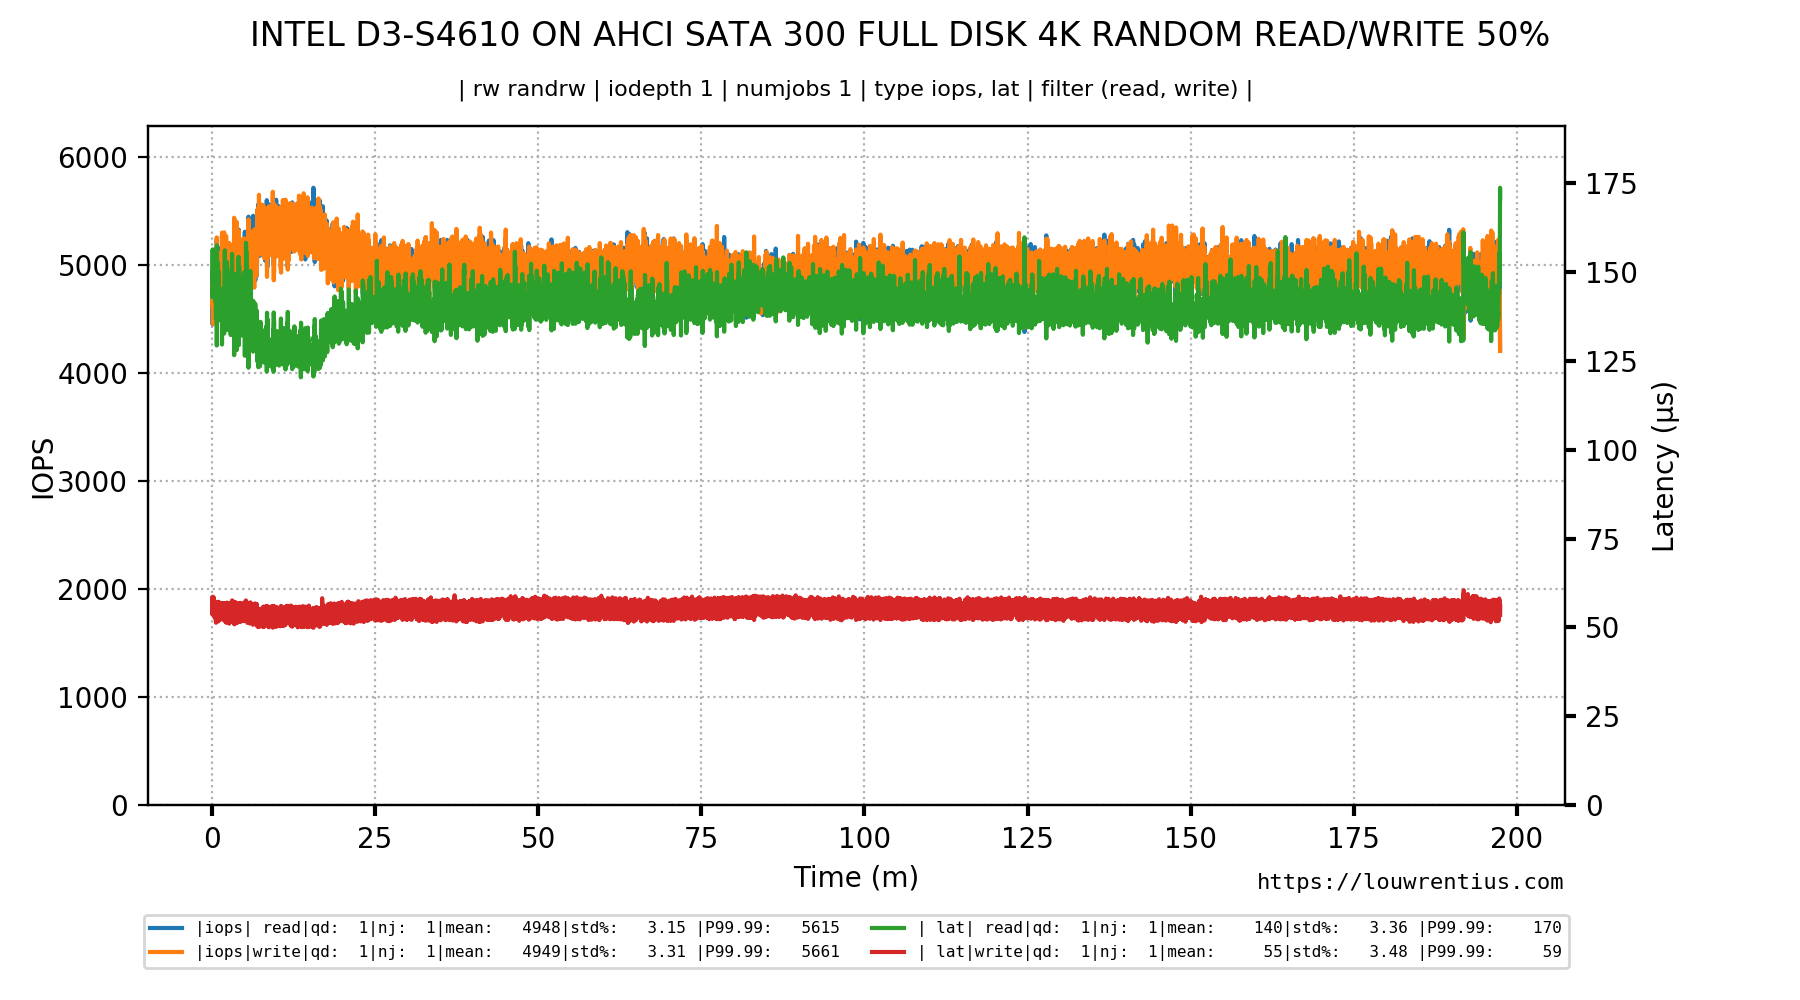
Intel D3-S4610
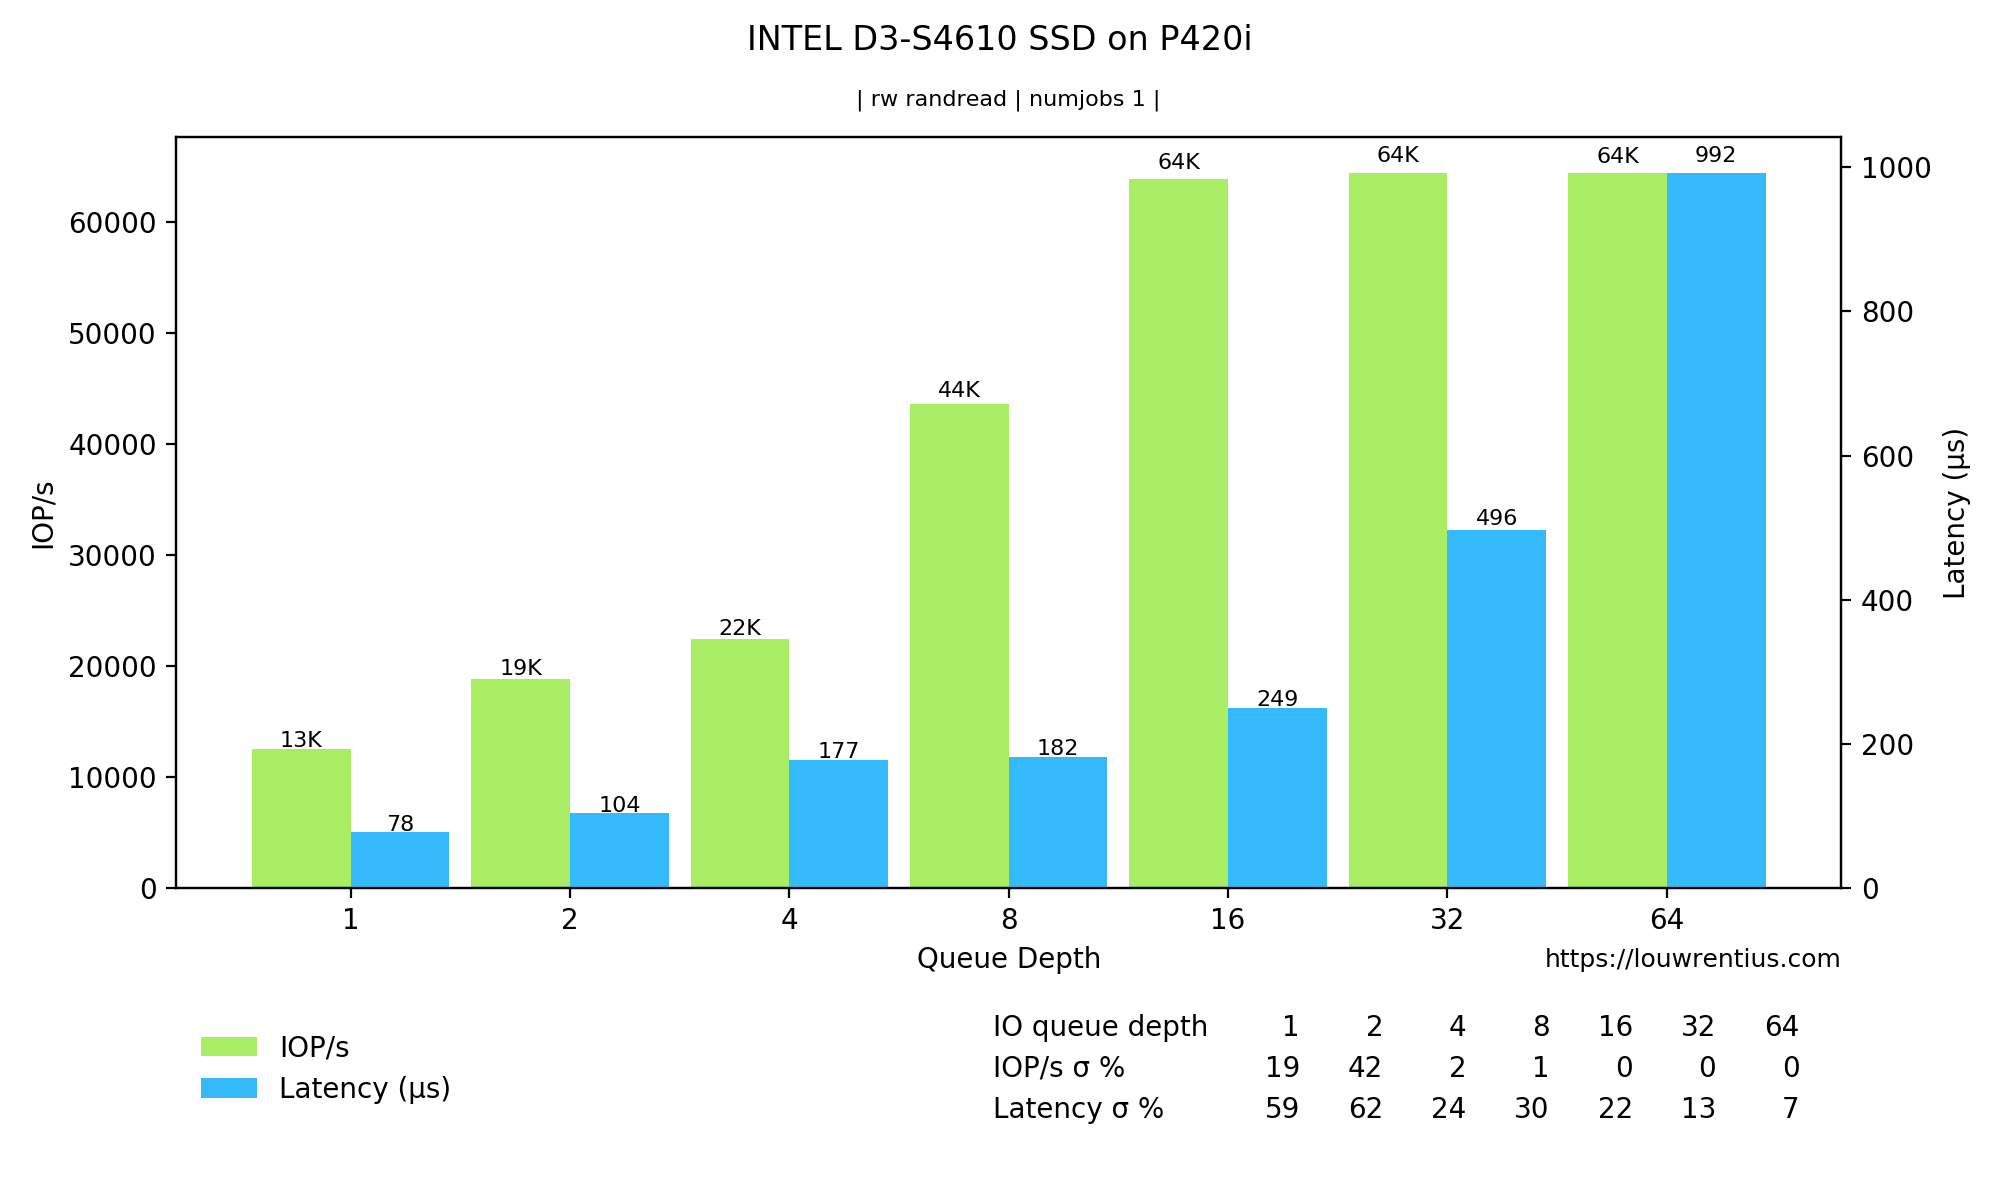
This SSD is meant for for datacenter usage. This is the test result on the P420i controller.
_Full_Device_Read+Write_2019-11-28_144750.png?raw=true)
IOPS and Latency is consistent during the whole benchmark. It's behaviour seems predictable.
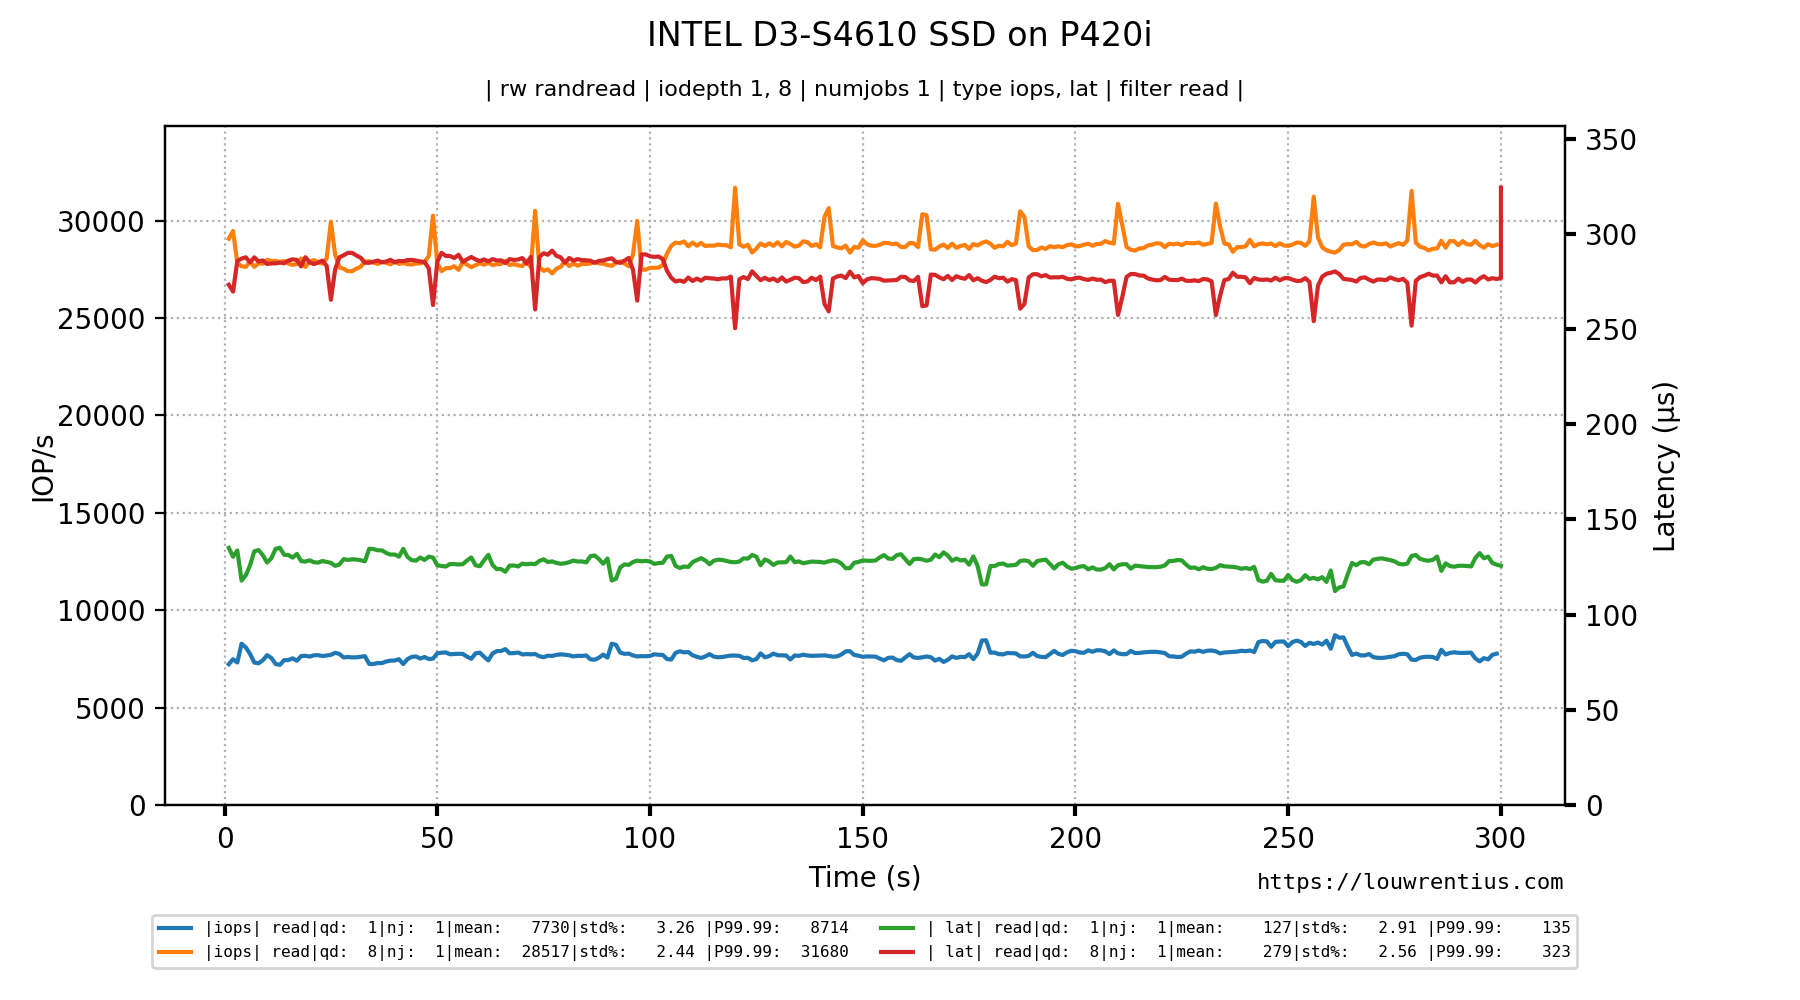
This is the test result on the AHCI controller:
Samsung 860 Pro
This SSD is meant for desktop usage. Its behavior seems quite different from the Intel SSD. I have separated the IOPS data from the Latency data to make the graphs more eligible.
This is the test result on the P420i controller.
IOPS
-Full-Device-Read+Write-IOPS-2020-01-29_171841.png?raw=true)
Latency
-Full-Device-Read+Write-Latency-2020-01-29_171858.png?raw=true)
The best-case latency is almost four times better than the worst-case latency. Latency is thus less predictable. This impact also seems to be reflected in the IOPs numbers.
This is the test result on the AHCI controller:

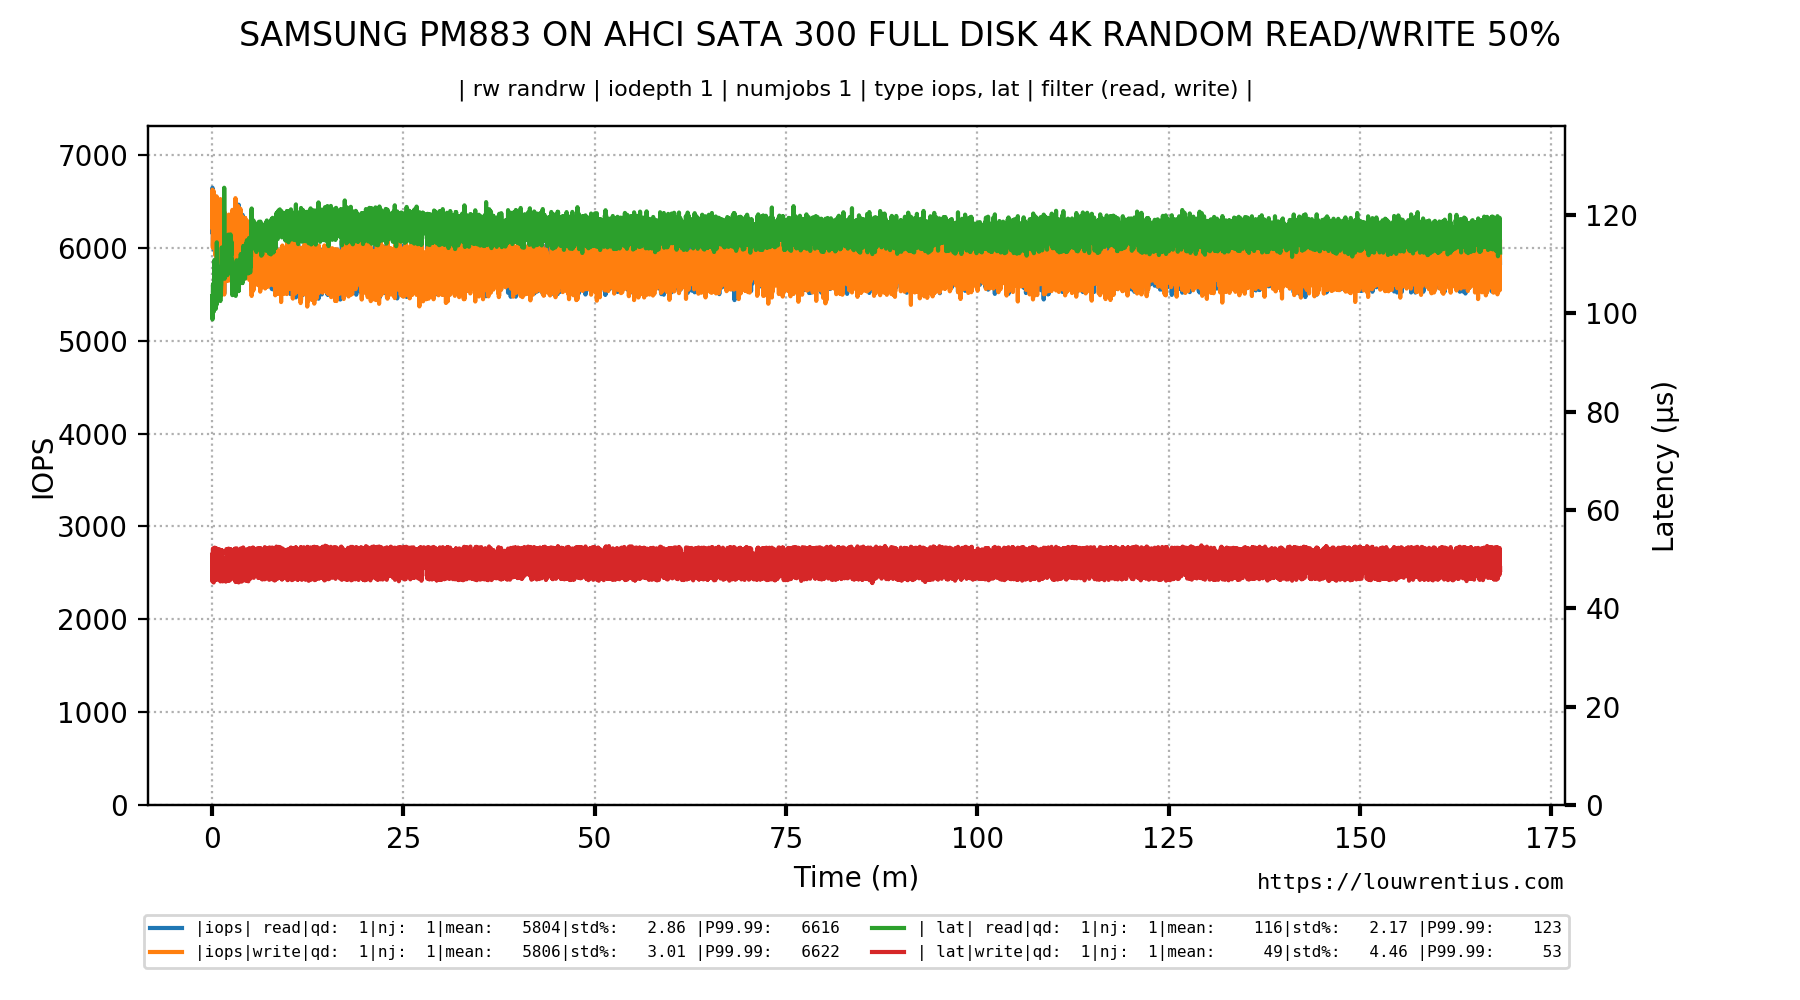
Samsung PM883
This SSD is meant for datacenter usage. This is the test result on the P420i controller.
IOPS
-Full-Device-Read+Write-IOPS-2020-01-29_174112.png?raw=true)
Latency
-Full-Device-Read+Write-Latency-2020-01-29_174135.png?raw=true)
This SSD seems to behave in a similar way as the 860 PRO.
This is the test result on the AHCI controller:
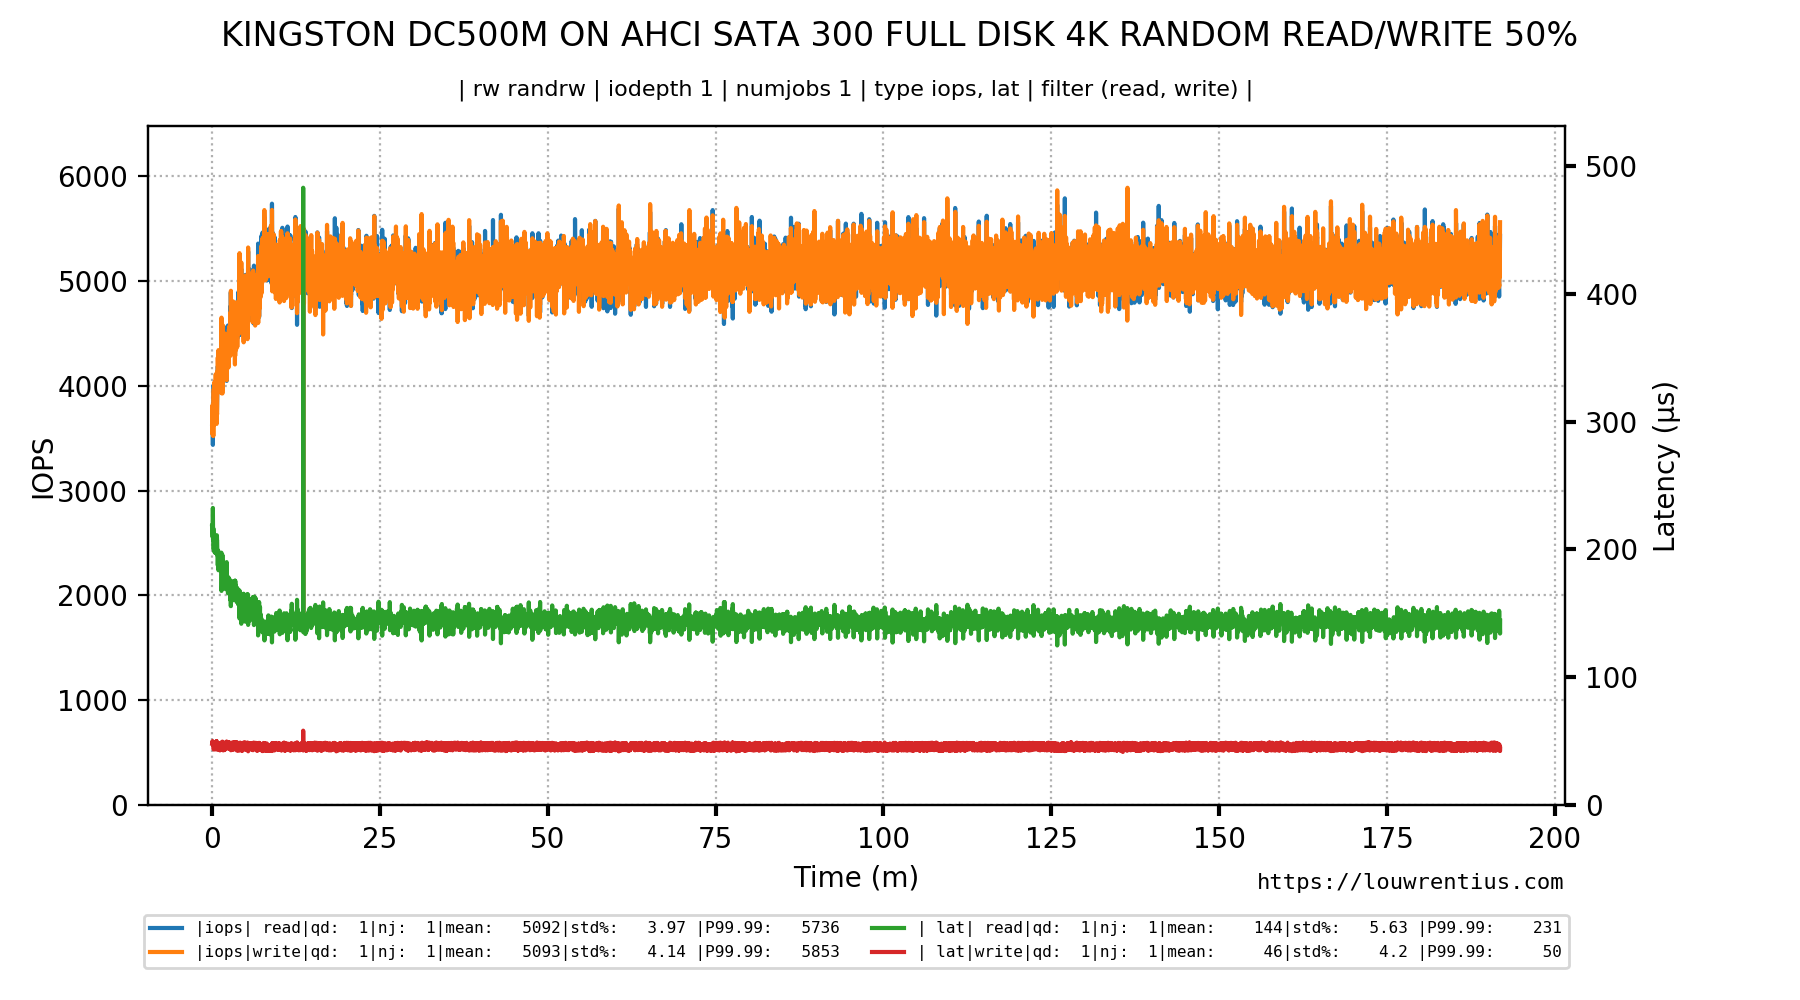
Kingston DC500M
This SSD is meant for datacenter usage. This is the test result on the P420i controller.
IOPS
-Full-Device-Read+Write-IOPS-2020-01-29_175551.png?raw=true)
latency
-Full-Device-Read+Write-Latency-2020-01-29_175612.png?raw=true)
The behavior of this SSD seems similar to the behaviour of the Samsung SSDs but the pattern is distinct: it seems shifted as compared to the Samsung SSDs.
This is the test result on the AHCI controller:
Evaluation
** Updated evaluation**
We can conclude that the P420i RAID controller causes strange behavior not observed when we test the SSDs on a regular AHCI controller. Although this was an older SATA 300 controller, I'm making the assumption that this controller still has enough bandwidth to support a random 4K test as most tests never went beyond 50+ MB/s of throughput.
At this point, I can only say that I observe quite different behavior between the Intel SSD and the other SSDs from Samsung and Kingston. The problem is that I can't tell if this affects real-life day-to-day application performance.
It seems that although results for the Samsung and Kingston SSDs fluctuate quite a bit, it's quite possible that the fluctuations occur during a very short timespan and effectively cancel each other out.
If you have comments, ideas or suggestions, leave a comment below.
How are these images generated?
All images have been generated with fio-plot.
The github repository also contains a folder with a lot of example images.