New release of fio-plot
I've rewritten fio-plot, a tool that turns FIO benchmark data into nice charts. It allows you to create four types of graphs which will be discussed below.
The github project page explains how to run this tool.
Fio-plot also includes a benchmark script that automates testing with Fio.
The git repository also contains benchmark data, which can be used to test fio-plot.
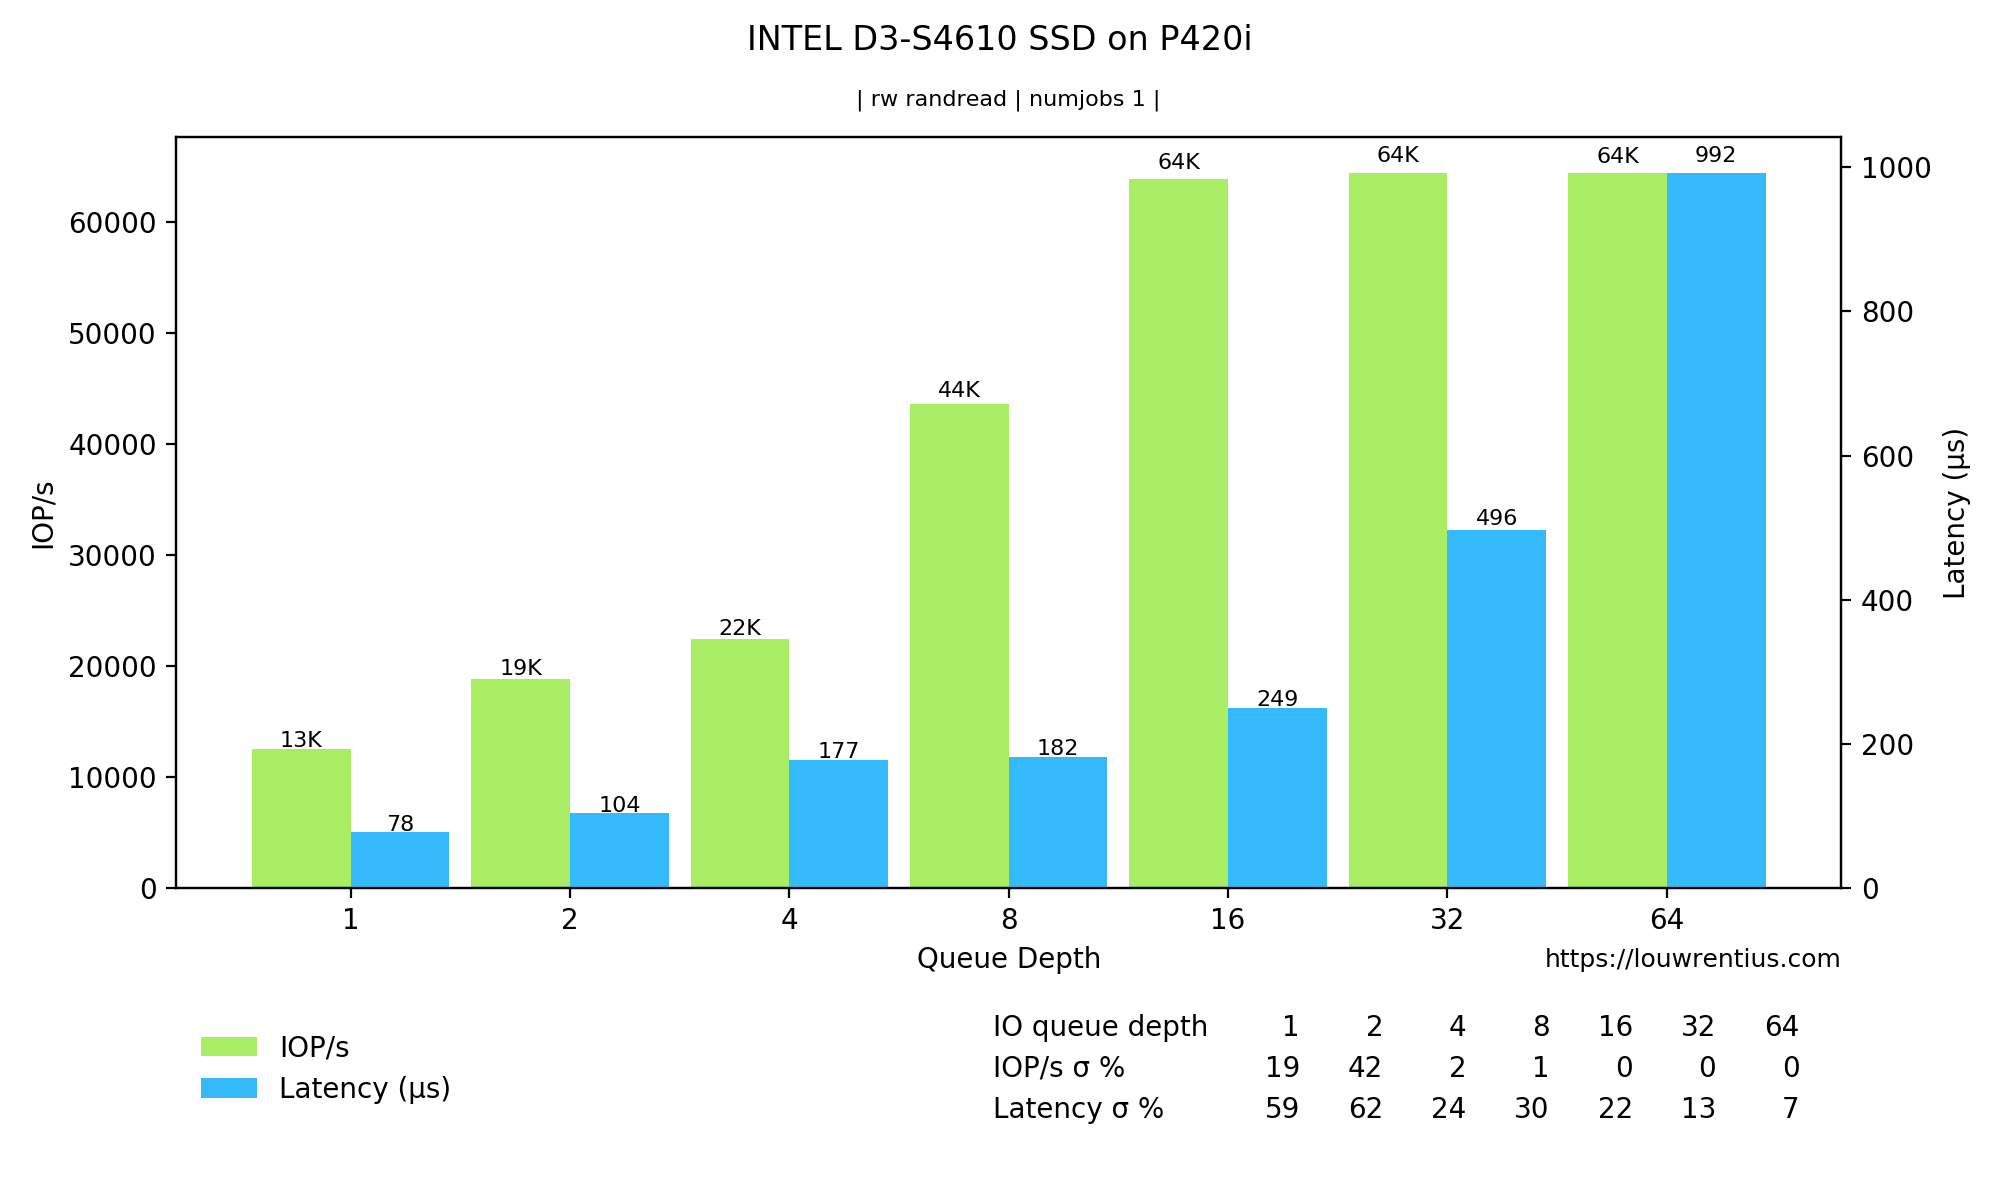
2D bar chart
This chart plots IOPs and latency for various queue depths.
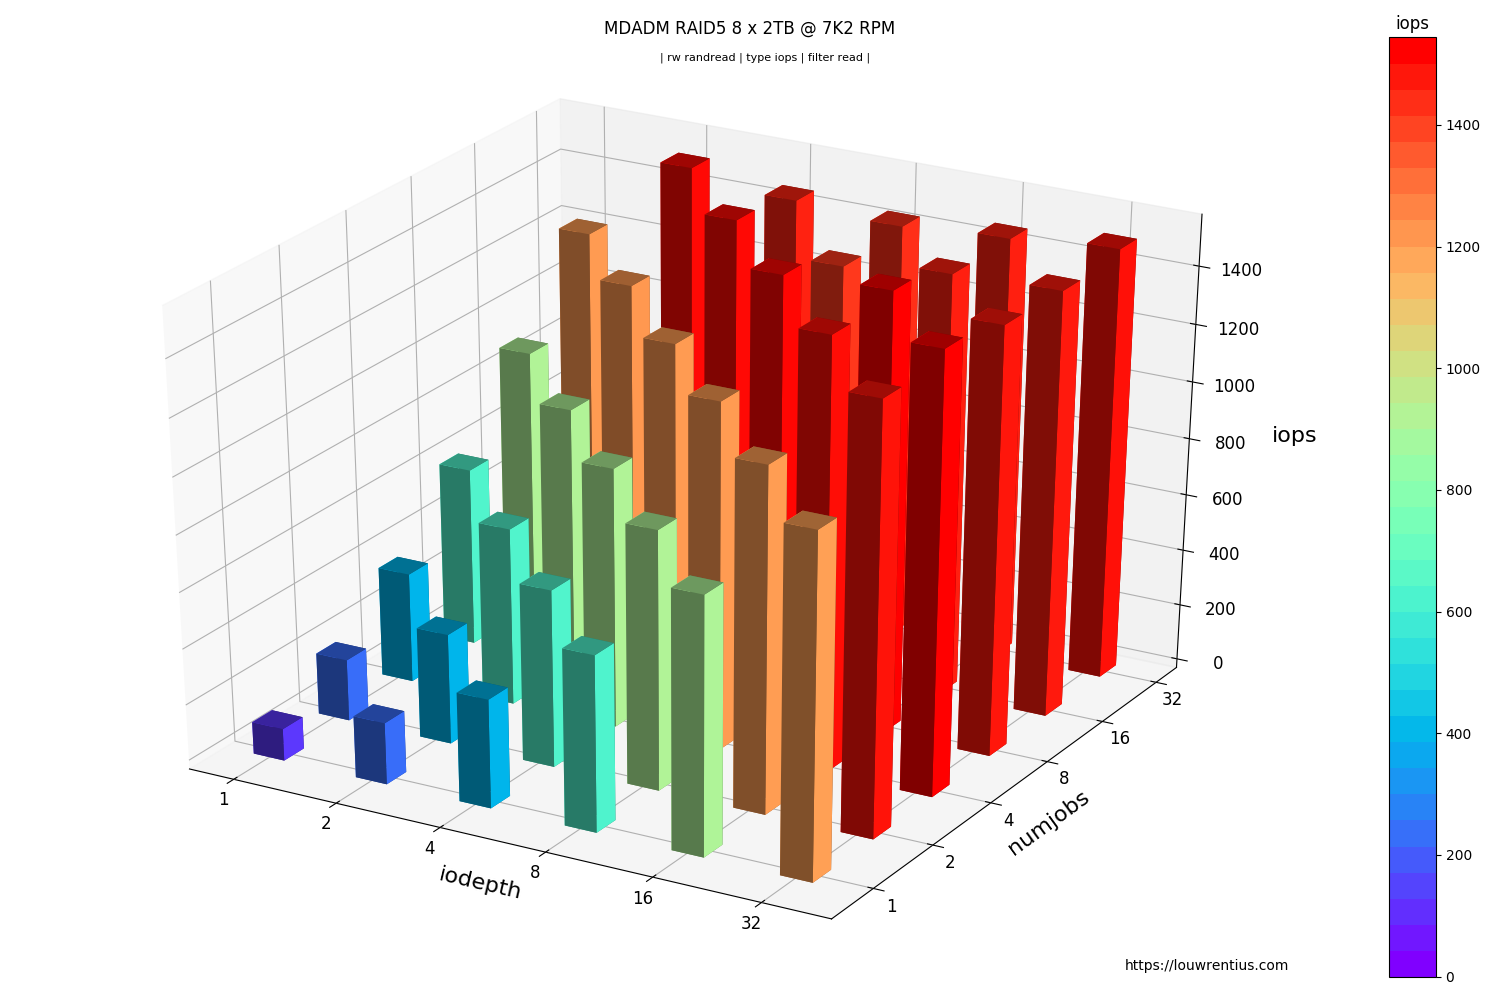
3D bar chart
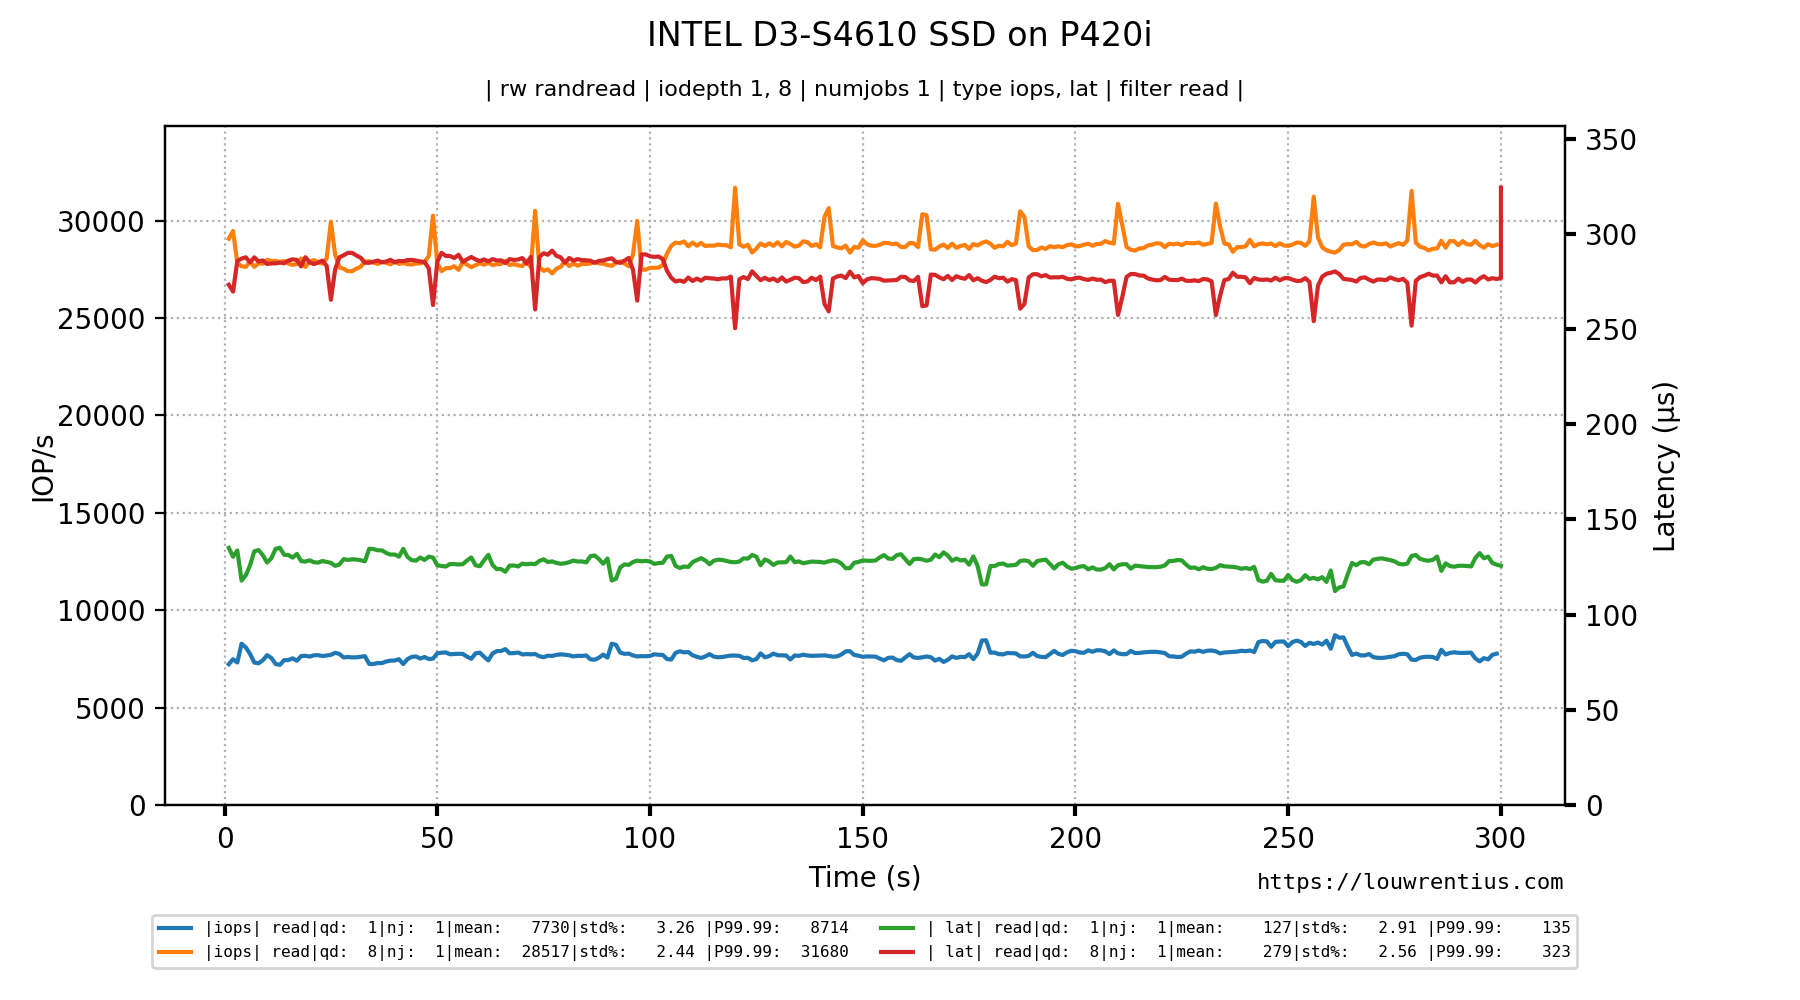
2D line chart for log data
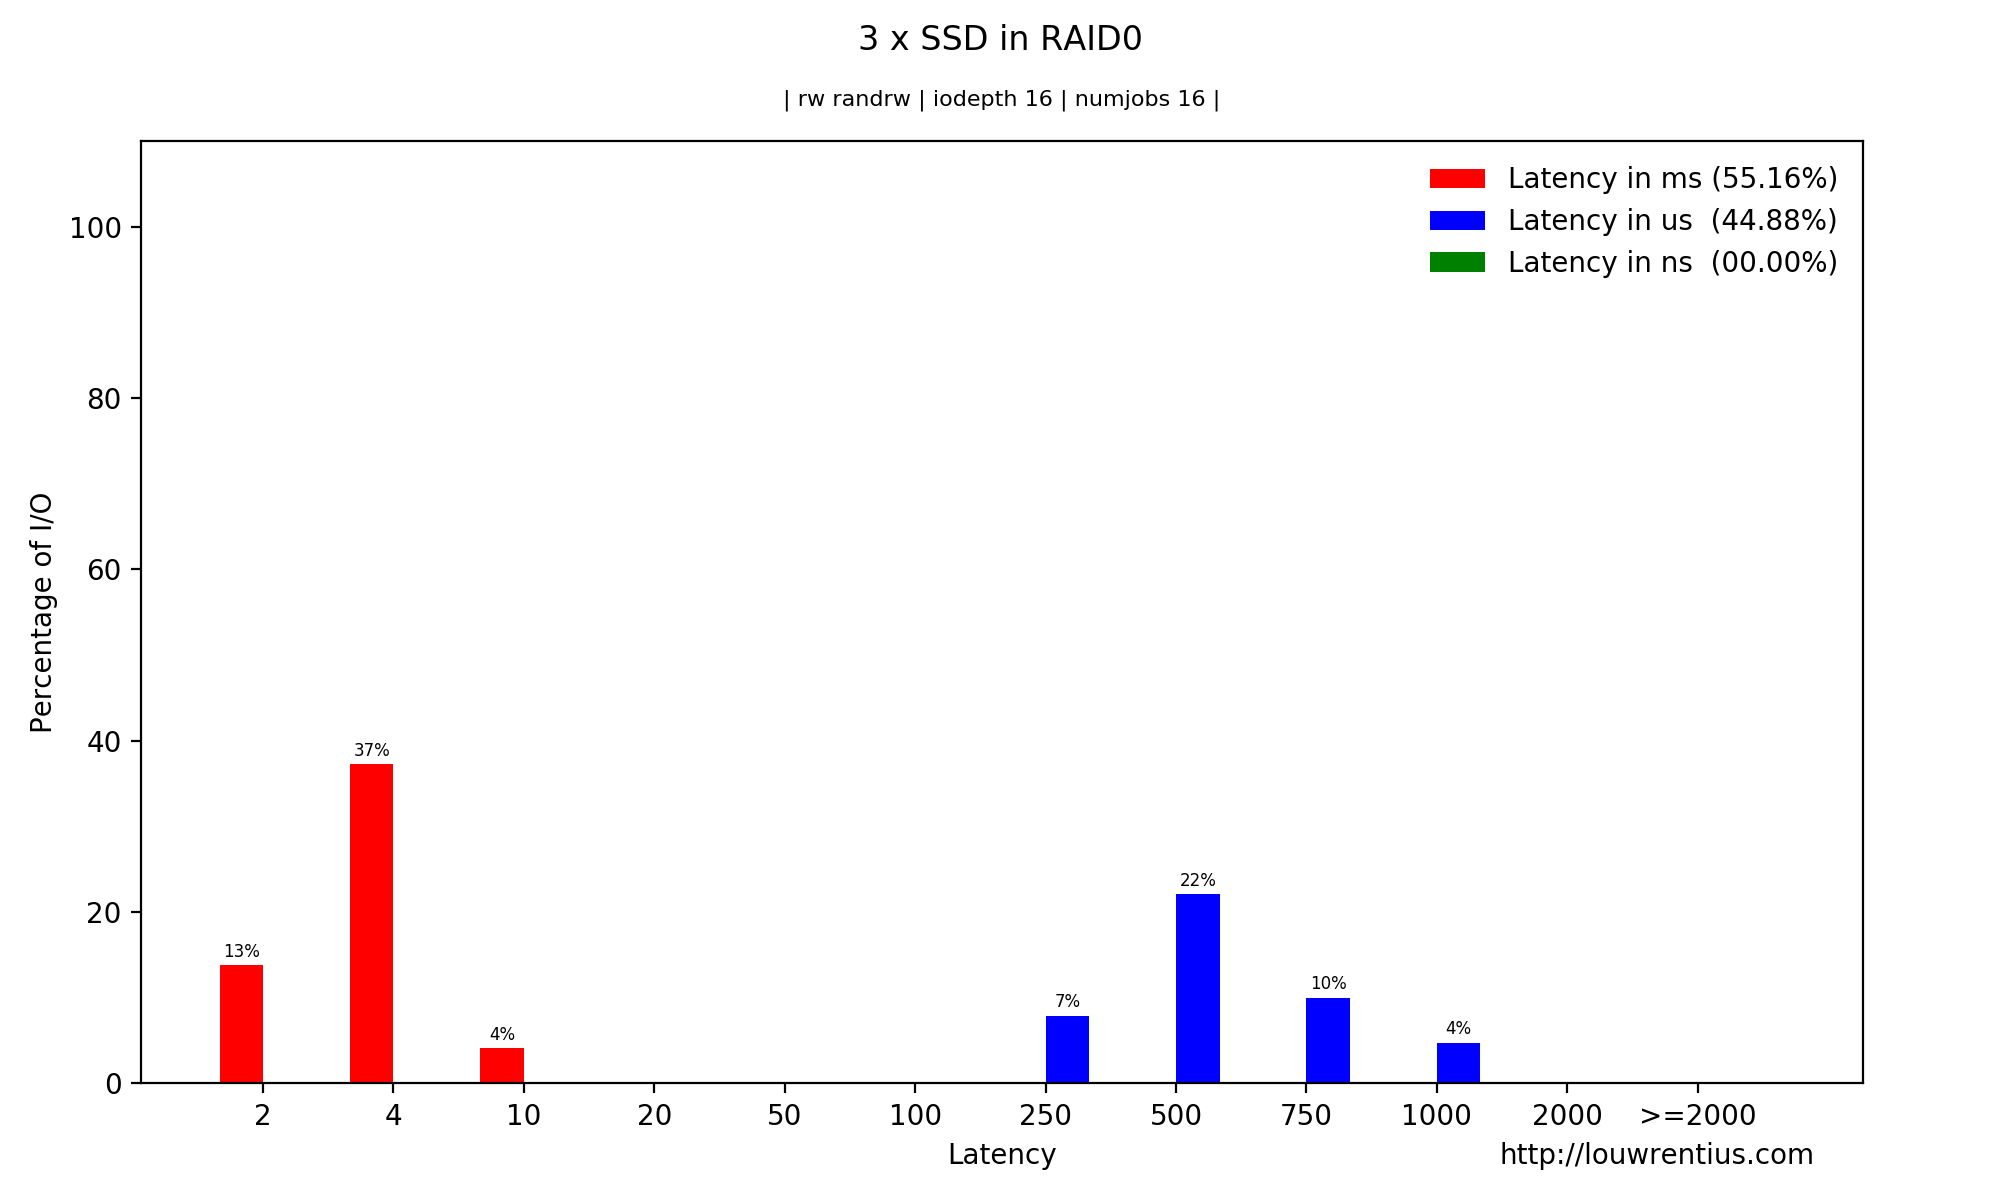
2D bar chart latency histogram
Additional images
The github repository also contains a folder with a lot of example images.

Comments