At work we have a couple of HP MSA P2000 G3 SANs. These are entry-level SANs that still seem to have almost all features you might want from a SAN, except for official SSD-support.
It seems that the new MSA 2040 adds support for SSDs and also provides 4 GB cache per controller instead of the somewhat meager 2GB of the P2000.
Anyway, a very nice feature of the MSA P2000 G3 is the fact that the management interface also provides a well-documented API that allows you to collect detailed stats on subjects like:
- Overall enclosure status
- Reports on failed drives
- Controller CPU usage
- IOPs per controller
- IOPs per vdisk
- IOPs per disk
Thomas Weaver has written a Nagios plugin that does that: it collects this information and in turn you can graph it with pnp4nagios.
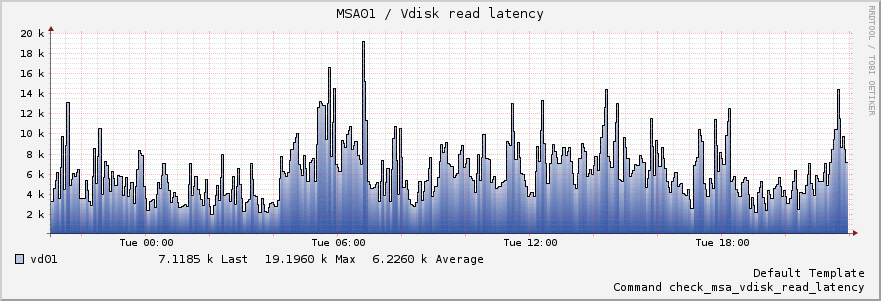
In more recent firmware updates HP has added support to monitor read and write I/O latency per vdisk. Latency is an important indicator for application-level performance so I was quite happy with that.
As the plugin by Thomas did not support reading these parameters yet, I spend some time implementing this check and submitted this new version of check_p2000_api.php back to Thomas.
Read Latency of a RAID 6 array
Write Latency of a RAID 6 array
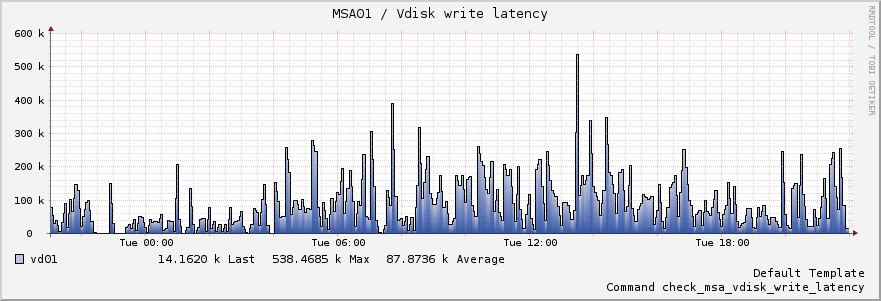
You will notice that the write latency of this disk array is very high at times, which seem to indicate that this vdisk is taxed too much with too many I/O-requests.
I'd like to thank Thomas Weaver for writing this plugin, I think it's very useful.