Introduction
I have performed some benchmarks to determine how different RAID levels perform when handling a 100% random workload of 4K requests. This is a worst-case scenario for almost every storage subsystem. Normal day-to-day workloads may not be that harsh in a real-life environment, but worst-case, these tests show what kind of performance you might expect when you face such a workload.
To create a worst-case worst-case solution, I even disabled write-caching for all write-related tests.
At the moment, I only have access to some consumer-level test hardware. In the future, I'd like to rerun these tests on some 10K RPM SAN storage drives to see how this turns out.
RAID levels tested
I have tested the following RAID levels:
- RAID 0
- RAID 10
- RAID 5
- RAID 6
Test setup
- CPU: Intel Core i5 2400s @ 2.5 GHz
- RAM: 4 GB
- Drives: 6 x 500 GB, 7200 RPM drives (SATA).
- Operating system: Ubuntu Linux
- RAID: Build-in Linux software RAID (MDADM)
- File system: XFS
- Test file size: 10 GB
- Test software: FIO read-config & write-config
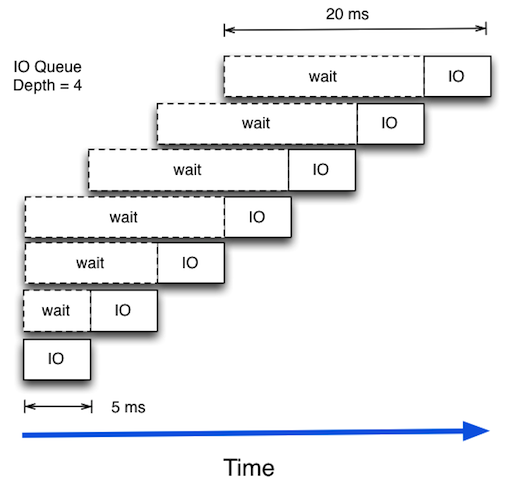
- Queue depth: 4
- Test script that generates RAID arrays, file systems and runs the tests.
- Cache: all write caching was disabled during testing (see script)
Test results
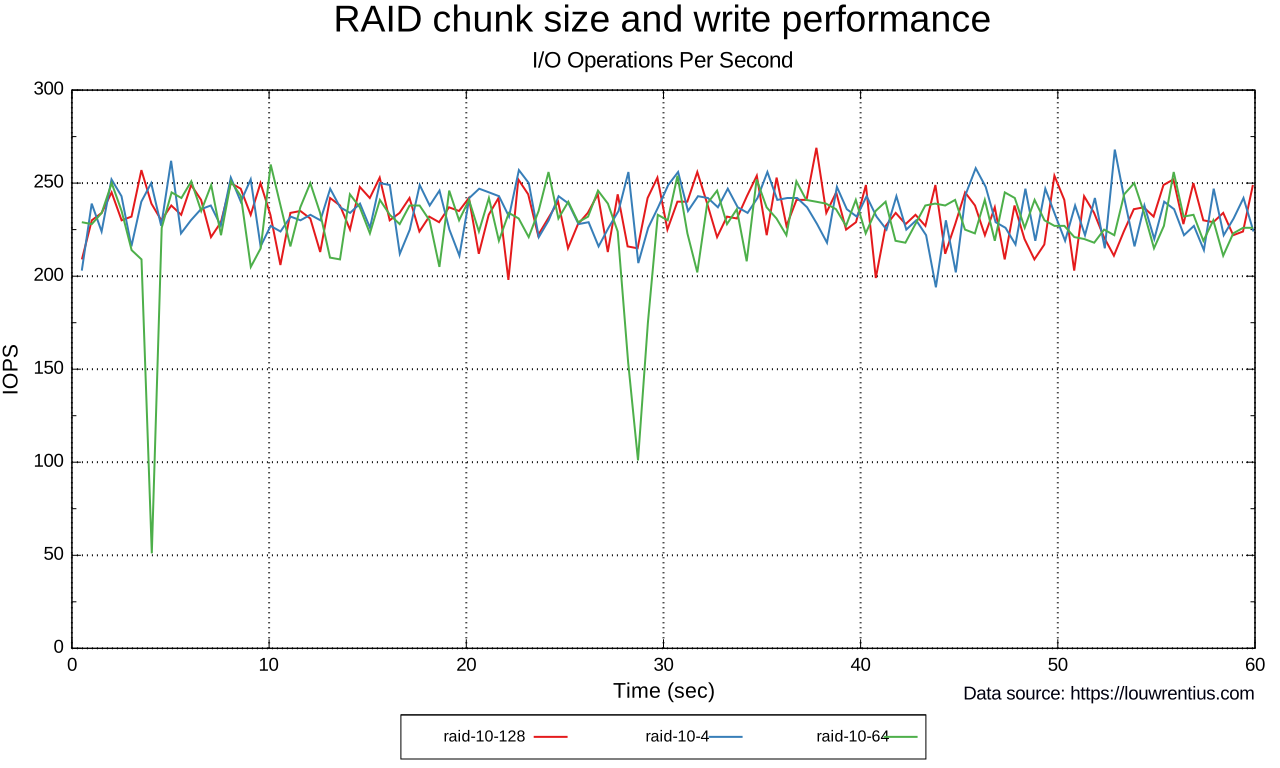
I also tested various chunk sizes for each RAID level. These are the results for RAID 10.
If you don't see any images, you are not using Internet Explorer 9, or a recent version of Google Chrome, Mozilla Firefox or Apple Safari.
Analysis
With this kind of testing, there are so many variables that it will be difficult to make any solid observations. But these results are interesting.
Results are in line with reality
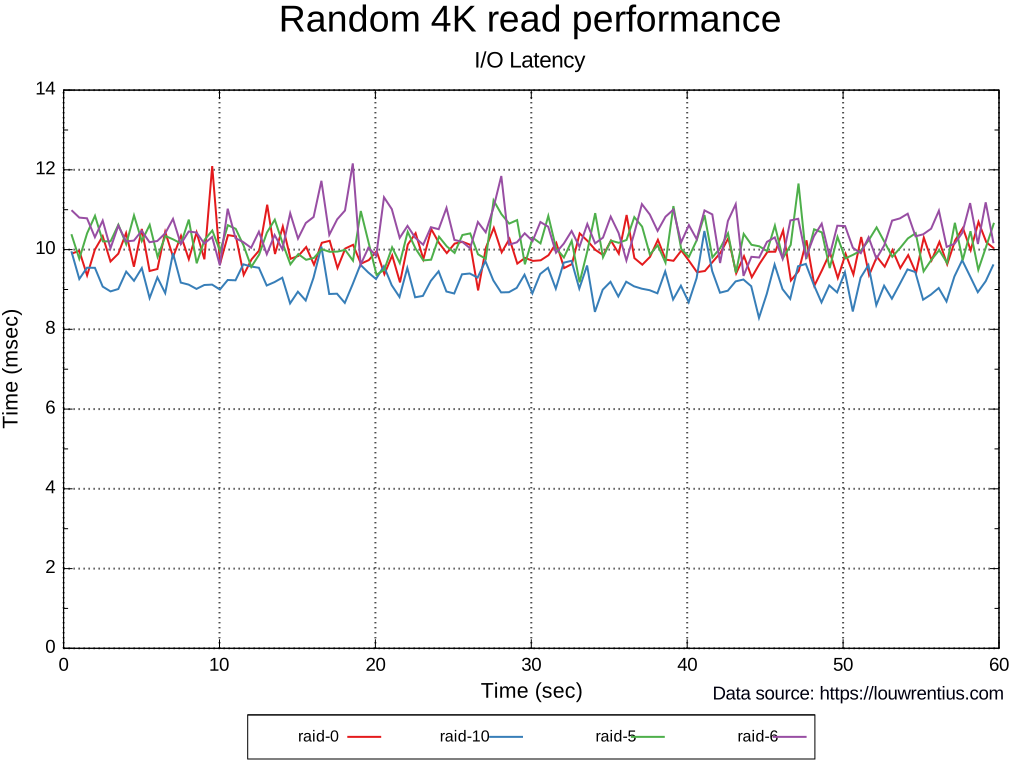
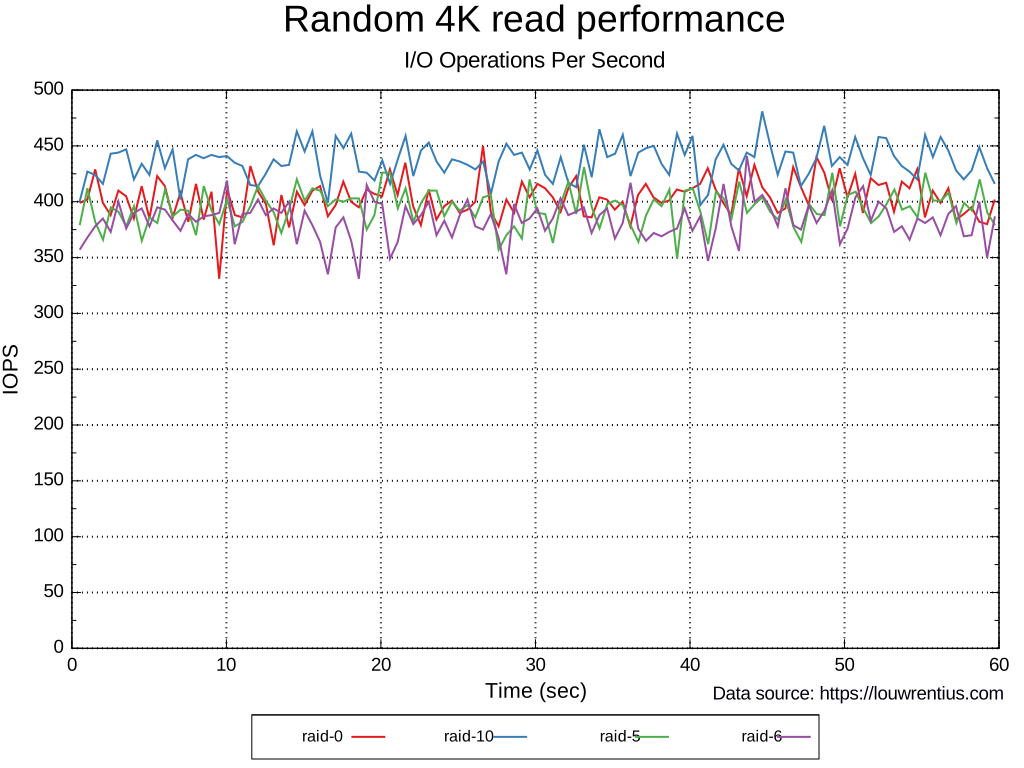
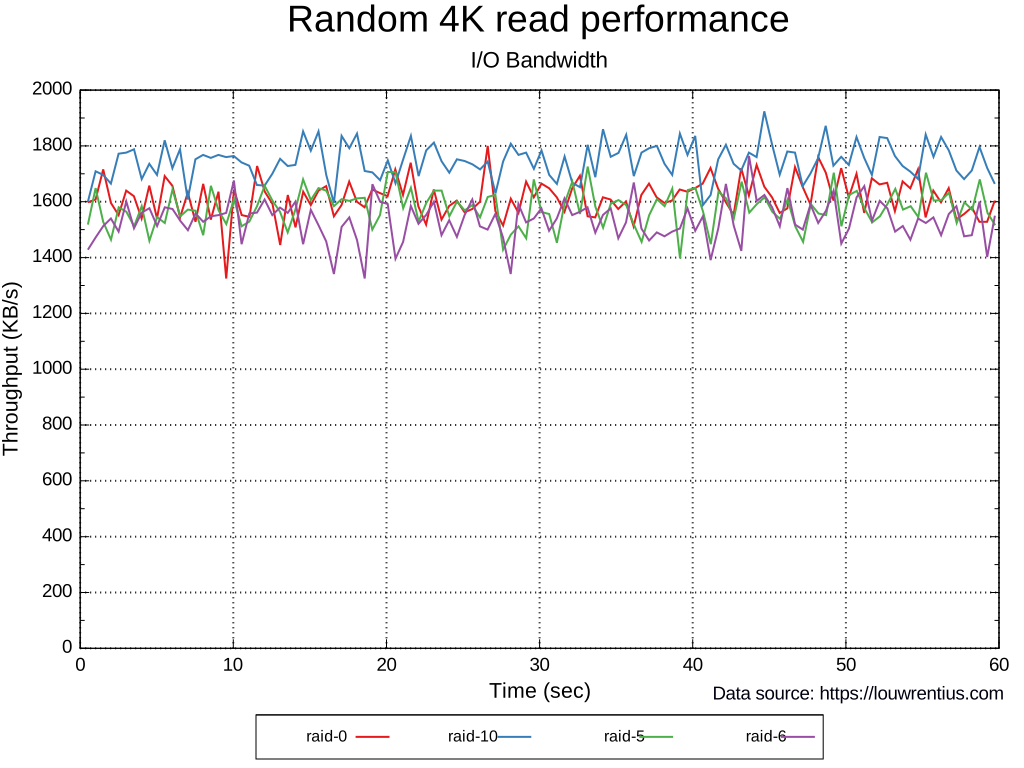
First of all, the results do not seem unexpected. Six drives at 7200 RPM should each provide about 75 IOPS. This should result in a total of 450 IOPS for the entire array. The read performance does show exactly this kind of performance.
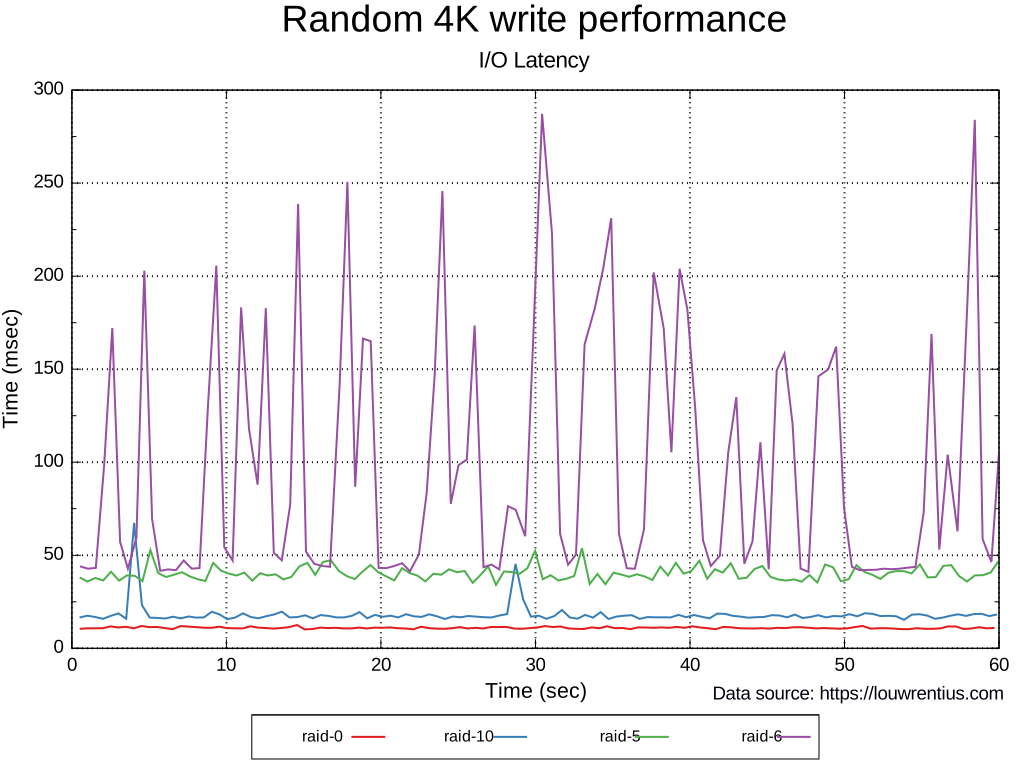
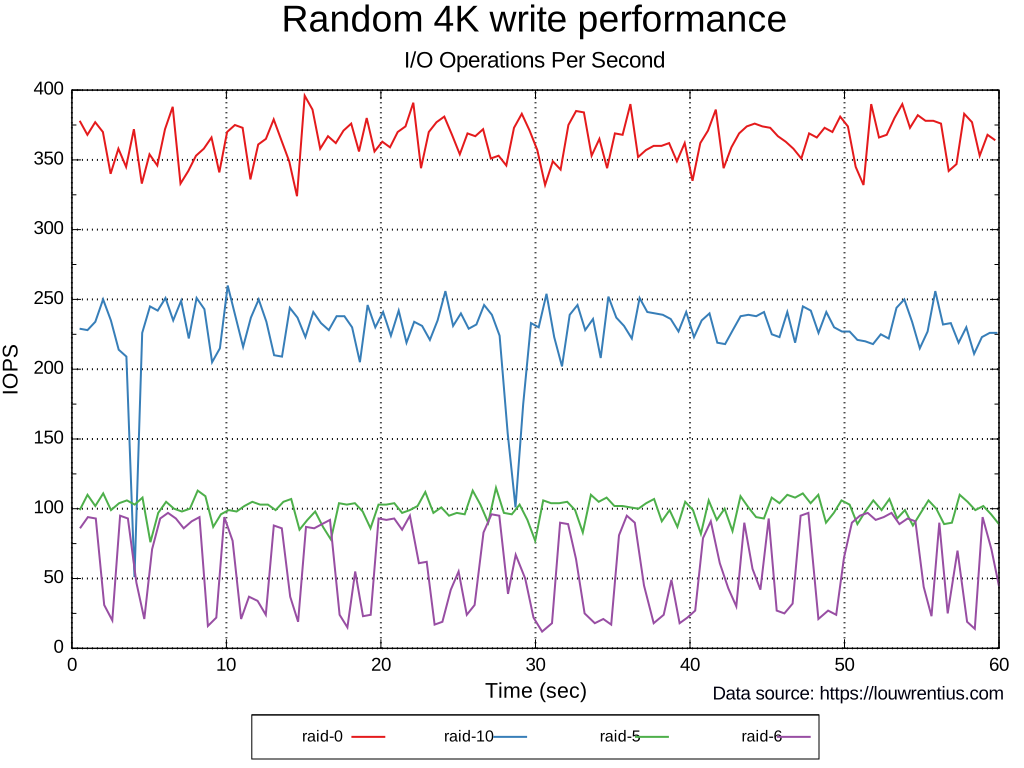
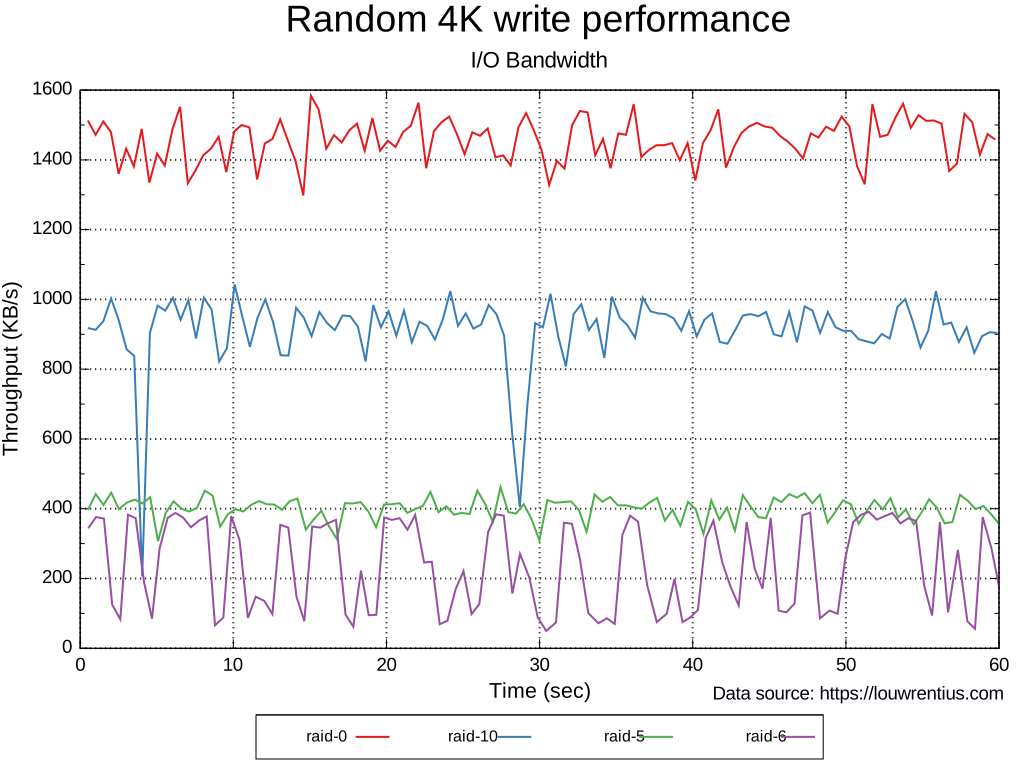
With all caching disabled, write performance is worse. And especially the RAID levels with parity (RAID 5 and RAID 6) show a significant drop in performance when it comes to random writes. RAID 6 write performance got so low and erratic that I wonder if there is something wrong with the driver or the setup. Especially the I/O latency is off-the-charts with RAID 6, so there must be something wrong.
Read performance is equal for all RAID levels
However, the most interesting graphs are about IOPS and latency. Read performance of all different RAID arrays is almost equal. RAID 10 seems to have the upper hand in all read benchmarks. I'm not sure why this is. Both bandwidth and latency are better than the other RAID levels. I'm really curious about a good technical explanation about why this should be expected. Edit: RAID10 is basically multiple RAID 1 sets stuck together. Data is striped across RAID 1 sets. When reading, a single stripe can be deliverd by both disks in the particular RAID mirror it resides on, thus there is a higher risk that one of the heads is in the vicinity of the requested sector.
RAID 0 is not something that should be used in a production environment, but it is included to provide a comparison for the other RAID levels. The IOPS graph regarding write performance is most telling. With RAID 10 using 6 drives, you only get the effective IOPS of 3 drives, thus about 225 IOPS. This is exactly what the graph is showing us.
Raid with parity suffers regarding write performance
RAID 5 needs four write I/Os for every application-level write request. So with 6 x 75 = 450 IOPS divided by 4, we get 112,5 IOPS. This is also on par with the graph. This is still ok, but notice the latency: it is clearly around 40 milliseconds, whereas 20 milliseconds is the rule of thumb where performance will start to significantly degrade.
RAID 6 needs six write I/Os for every application-level write request. So with 450 IOPS total, divided by 6, we only have single-disk performance of 75 IOPS. If we average the line, we do approximately get this performance, but the latency is so erratic that it would not be usable.
RAID chunk size and performance
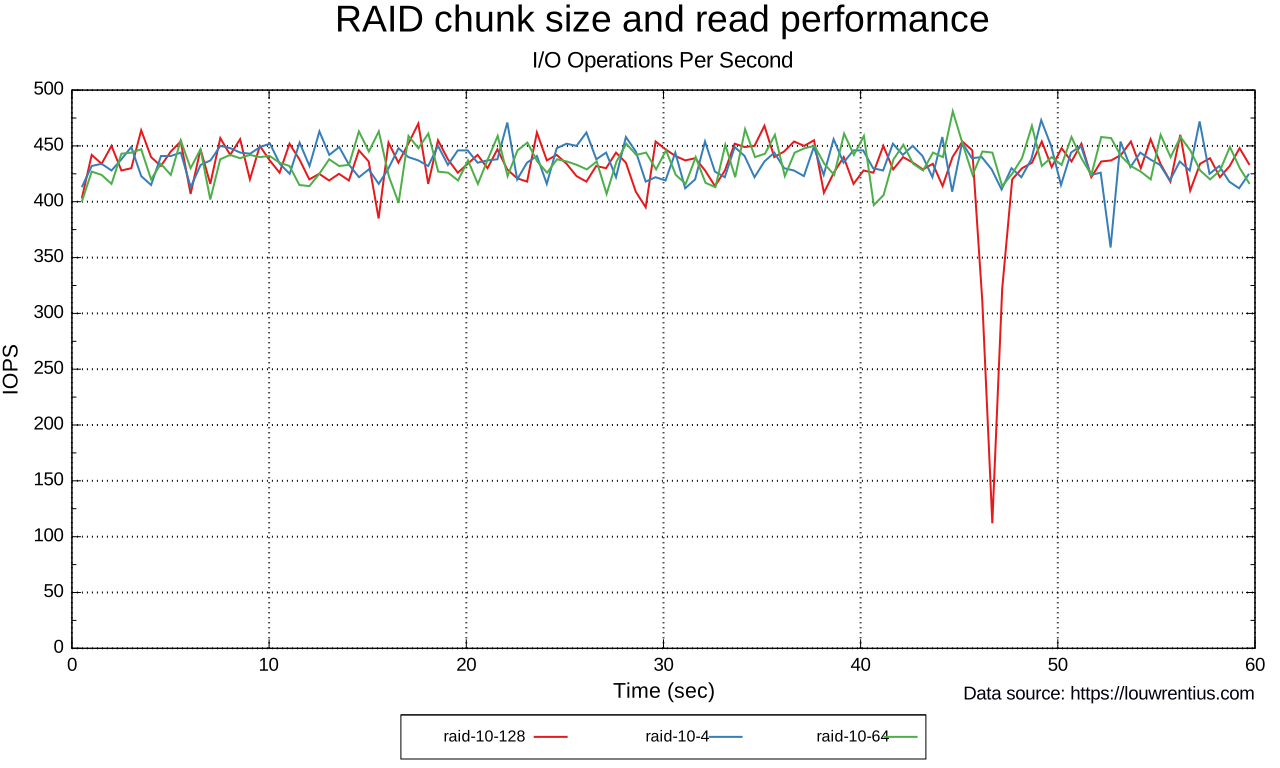
So I was wondering if the RAID array chunk size does impact random I/O performance. It seems not.
Conclusion
Overall, the results seem to indicate that the actual testing itself is realistic. We do get figures that are in tune with theoretical results.
The erratic RAID 6 write performance would need a thorougher explanation, one that I can't give.
Based on the test results, it seems that random I/O performance for a single test file is not affected by the chunk size or stripe size of an RAID array.
The results show to me that my benchmarking method provides a nice basis for further testing.