This is a brief article in which I compare the IKEA VINDSTYRKA $50 air quality monitor (PM2.5) with a $290 air quality monitor made by Dylos to see if it's any good.
Context
If you care about indoor air quality, you may already own a CO2 to determine if it's time to ventilate your space a bit1.
But a CO2 monitor doesn't tell you anything about the amount and size of particulate matter in the air.
Of particular interest are very fine particles, in the "PM2.5" category. Those particles are 2.5 micrometers or smaller in diameter can embed themselves deep inside the lungs and cause health issues.
Both air quality monitoring devices are specifically measuring PM2.5 particulate matter, so that's what we will focus on in this test.
DYLOS DC1100 PRO
I bought a Dylos DC1100 Pro in 2014 as I was quite interesting in the topic of air quality at that time. As I had to import the device, I believe I had to pay around 400 Euros for it but it's now for sale in the US for around $290.
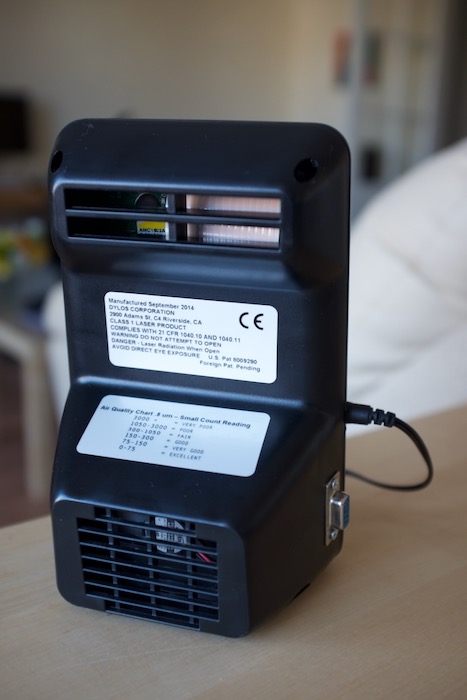 click on the image for a picture of the back
I specifically chose this model because it has a serial port, which allows me to log data and maybe spot some trends. I was thinking about using this data to control my air circulation system in my home, but I never got around to building this.
This device (without serial port) is also explored in-depth by Matthias Wandel, who many of you probably know from his 1.7M subscribers Youtube channel. Tip: he shows the inside of the device.
Note that this video is from 10 years ago and I find it remarkable that the Dylos 1100 Pro is still sold - seemingly unmodified - over the years.
The IKEA VINDSTYRKA
Recently, I discovered that IKEA is now selling the VINDSTYRKA air quality monitor with support for Zigbee. The product is intended to be used with IKEAs range of air purifiers, to better finetune the behaviour of those devices.
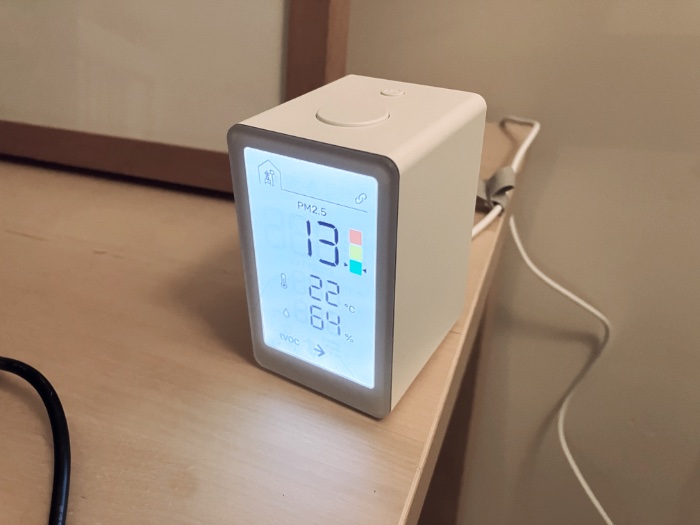
The device measures PM2.5 particulate matter and also monitors temperature and humidity. All data is exposed over Zigbee. I've not tested this myself but I wonder how long it would last on a battery bank as it's USB powered.
Due to the low price tag, I decided to compare this $50 device (€40) with my Dylos. I think it's quite an interesting device because the Zigbee support allows you to integrate the device in home automation and log data, if you have a need for that.
Data logging setup
De Dylos device is a bit of a pain, because the measurement values are in particulates per square foot, so I had to find a proper conversion formula, which I found in this paper (page 17). The formula is:
PM2.5 Dylos DC1100 (μg/m3) = (particles > 0.5 μm minus particles > 2.5 μm)/250.
A Raspberry Pi 3B+ is running a Python script that reads the data from the serial port, converts it to PM2.5 values using the previous mentioned formula and transmits it into an InfluxDB + Grafana server.
To log the VINDSTYRKA data, I used a Sonoff Zigbee receiver on a Raspberry Pi 4b+. I installed zigbee2mqtt as a docker container, Mosquitto MQTT server and Telegraf+MQTT-client to submit the data into InfluxDB, which sounds more convoluted than it actually was.
Test method
I just let both devices run for a few days in close proximity to each other in my living room. I kept a balcony door open 24/7. I also created a bit of smoke at some point just to observe how the devices would respond and how much they would deviate from each other. Nothing too scientific, to be frank.
Test result
I've plotted the data from the Dylos and the Ikea device in the same graph and I think the results are quite straightforward. The peak in the middle was my 'smoke test'.
Original
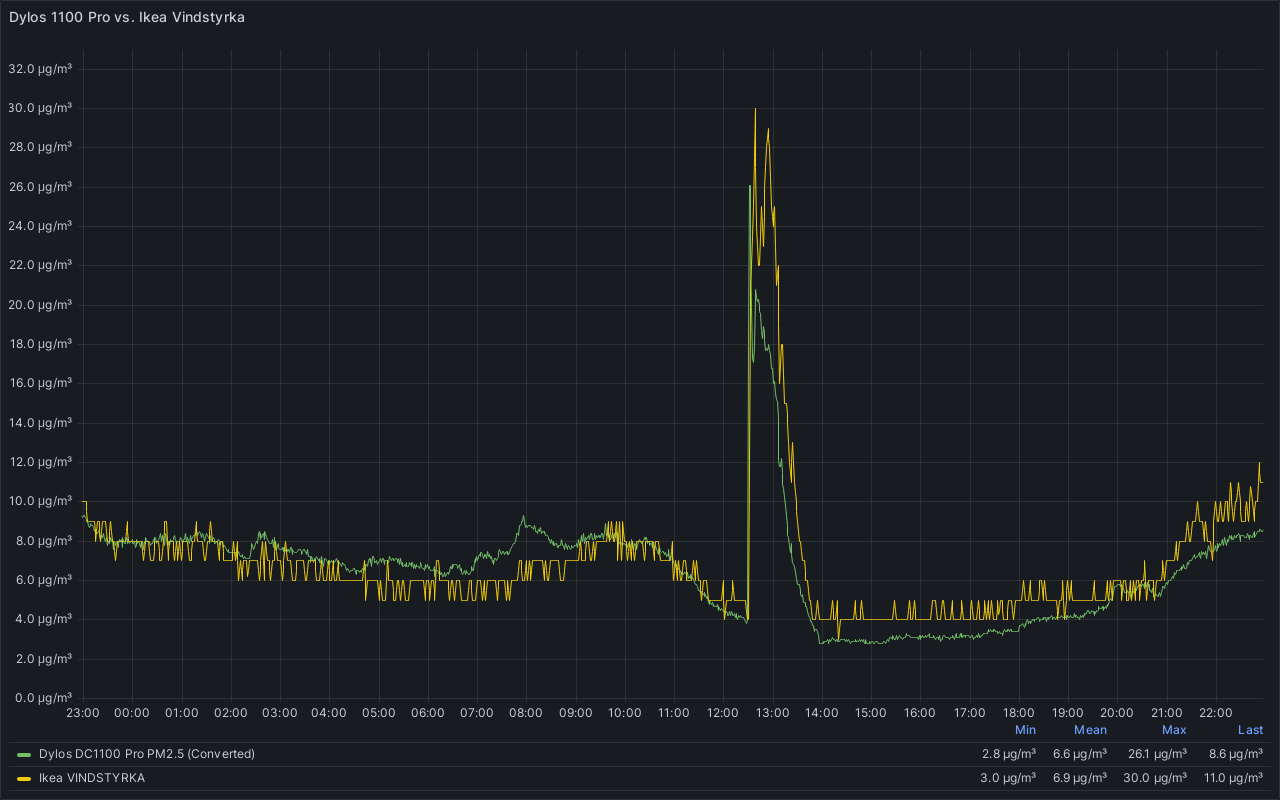 click on the image for a larger version
Updated
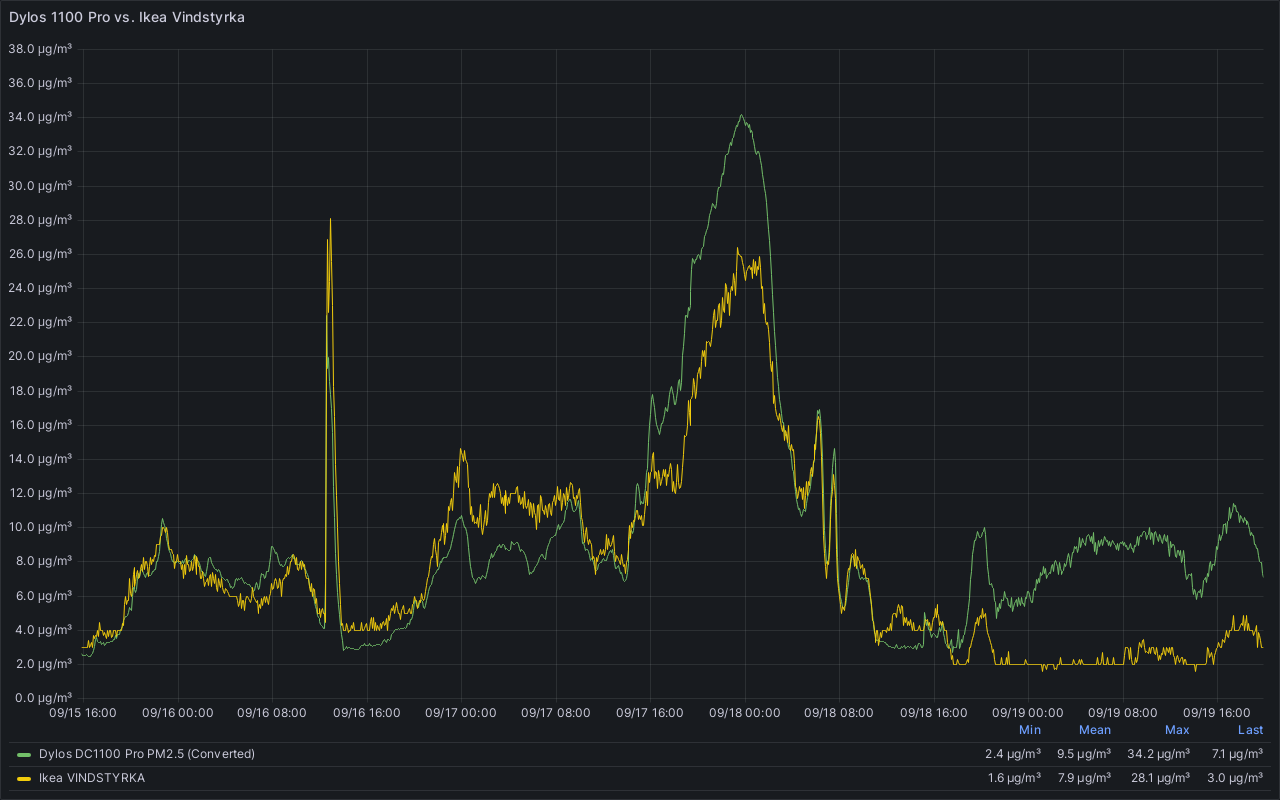 click on the image for a larger version
After a few days I noticed a clear deviation between the VINDSTYRKA and the Dylos DC1100 Pro at certain time intervals. I have no real explanation for this deviation and I can't tell which device shows 'correct' data.
If I try to follow the AQI PM2.5 values for my city, the VINDSTYRKA seems to under report and the Dylos seems to over-report PM2.5 particulate matter.
Evaluation
Based on my test, I think the VINDSTYRKA is good enough, looking at how closely the measurements track the results of the Dylos.
Update September 19th 2023 Based on the new graph data, it seems the Dylos and VINDSTYRKA are less in agreement over absolute PM2.5 values. I'm not sure what to make of it.
As both devices still seem to agree on basic trend data, I would say that they still operate in the same ballpark.
-
Maybe you are a home automation enthusiast and you've managed to automate this process. ↩