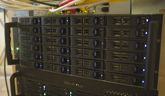
If you build a NAS with many drives, it may be of interest to you which drives get hot and where they are located in the chassis. My Norco 4020 case has twenty drives in RAID 6, plus two operating system drives in RAID 1. I wrote a script that shows me the temperature of each drive, positioned in such a way that it represents the actual physical location of the drive in the chassis:
 -- 30 -- | -- 27 --
 | 26 | 27 | 28 | 25 |
 | 30 | 32 | 30 | 29 |
 | 31 | 33 | 33 | 29 |
 | 33 | 32 | 35 | 30 |
 | 32 | 34 | 35 | 31 |
In this example, you can determine that the top drives seem to stay the coolest. The center and lower drives get hotter.
If you want to use this script, you will have to change it for your own specific setup. You can get it here.
This visual representation would also be nice to identify which drive has failed and where it is located in the chassis.
Comments