Introduction
Fio is a widely-used tool for performing storage benchmarks. Fio offers a lot of options to create a storage benchmark that would best reflect your needs. Fio allows you to assess if your storage solution is up to its task and how much headroom it has.
Fio outputs .json and .log files that need further processing if you would like to make nice charts. Charts may help better communicate your test results to other people.
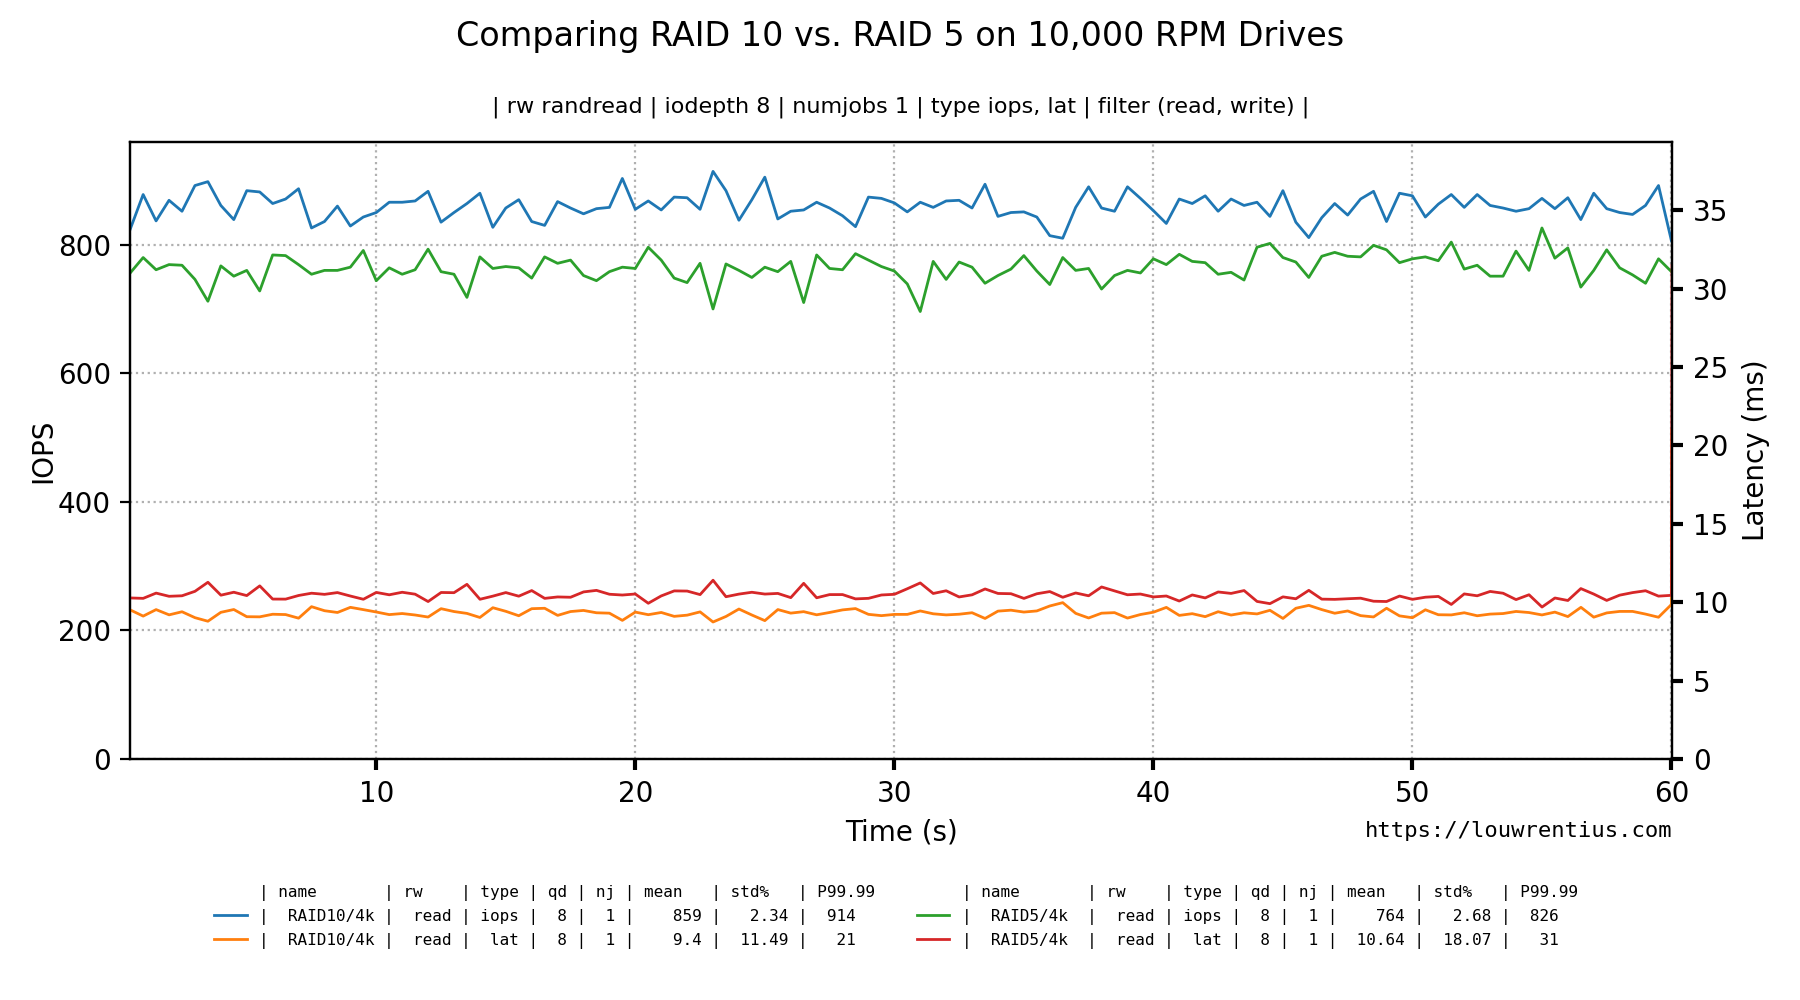
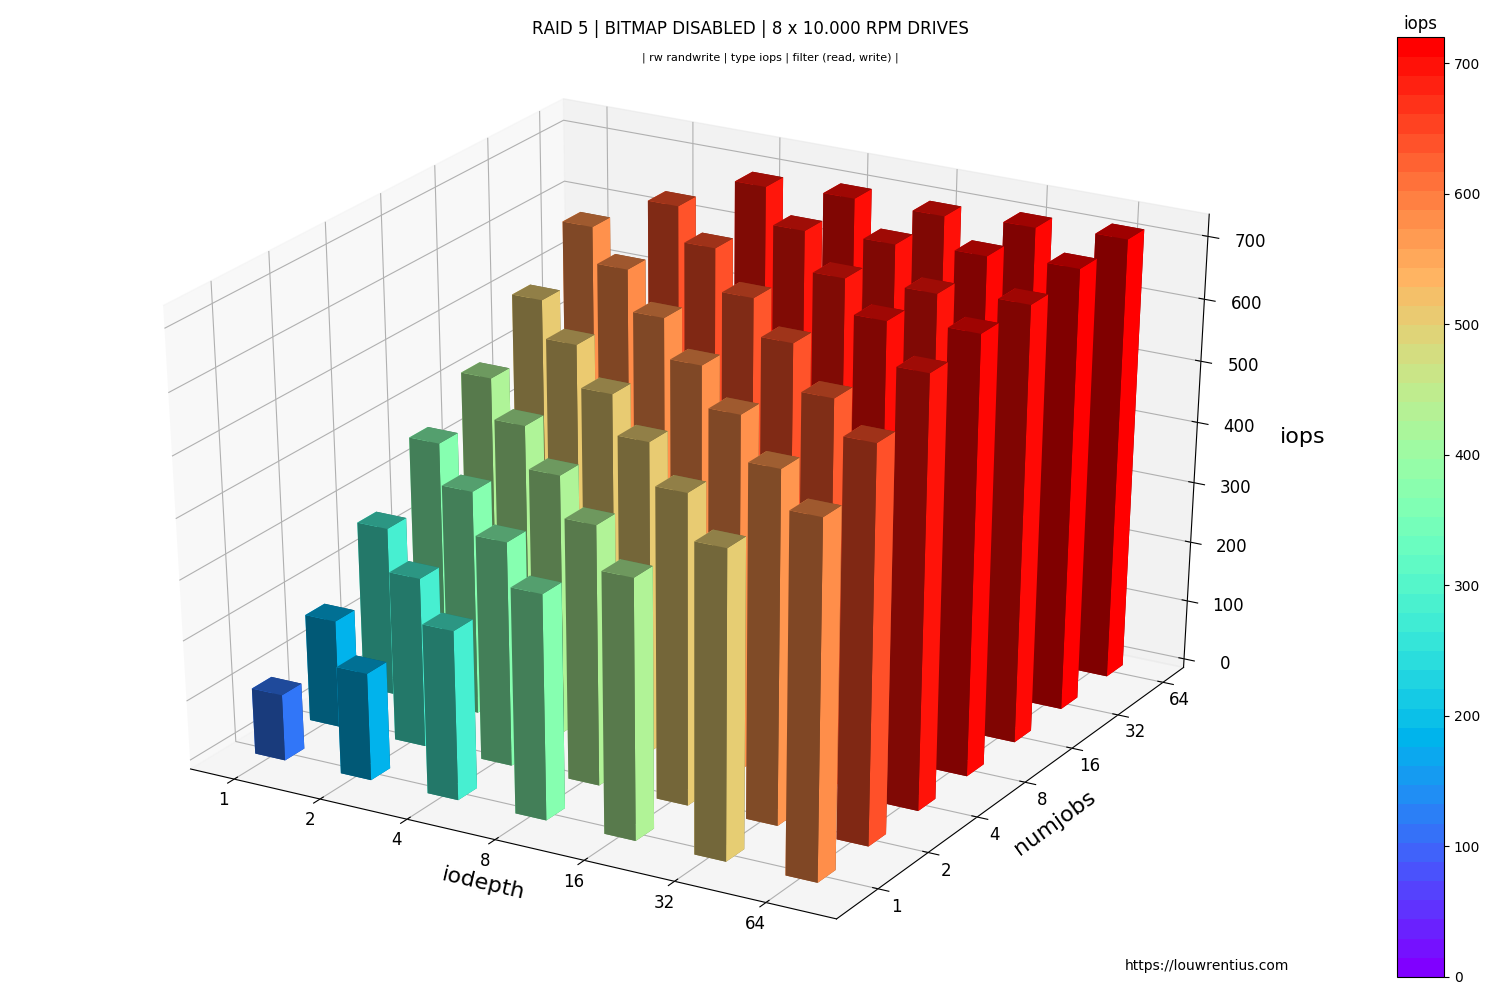
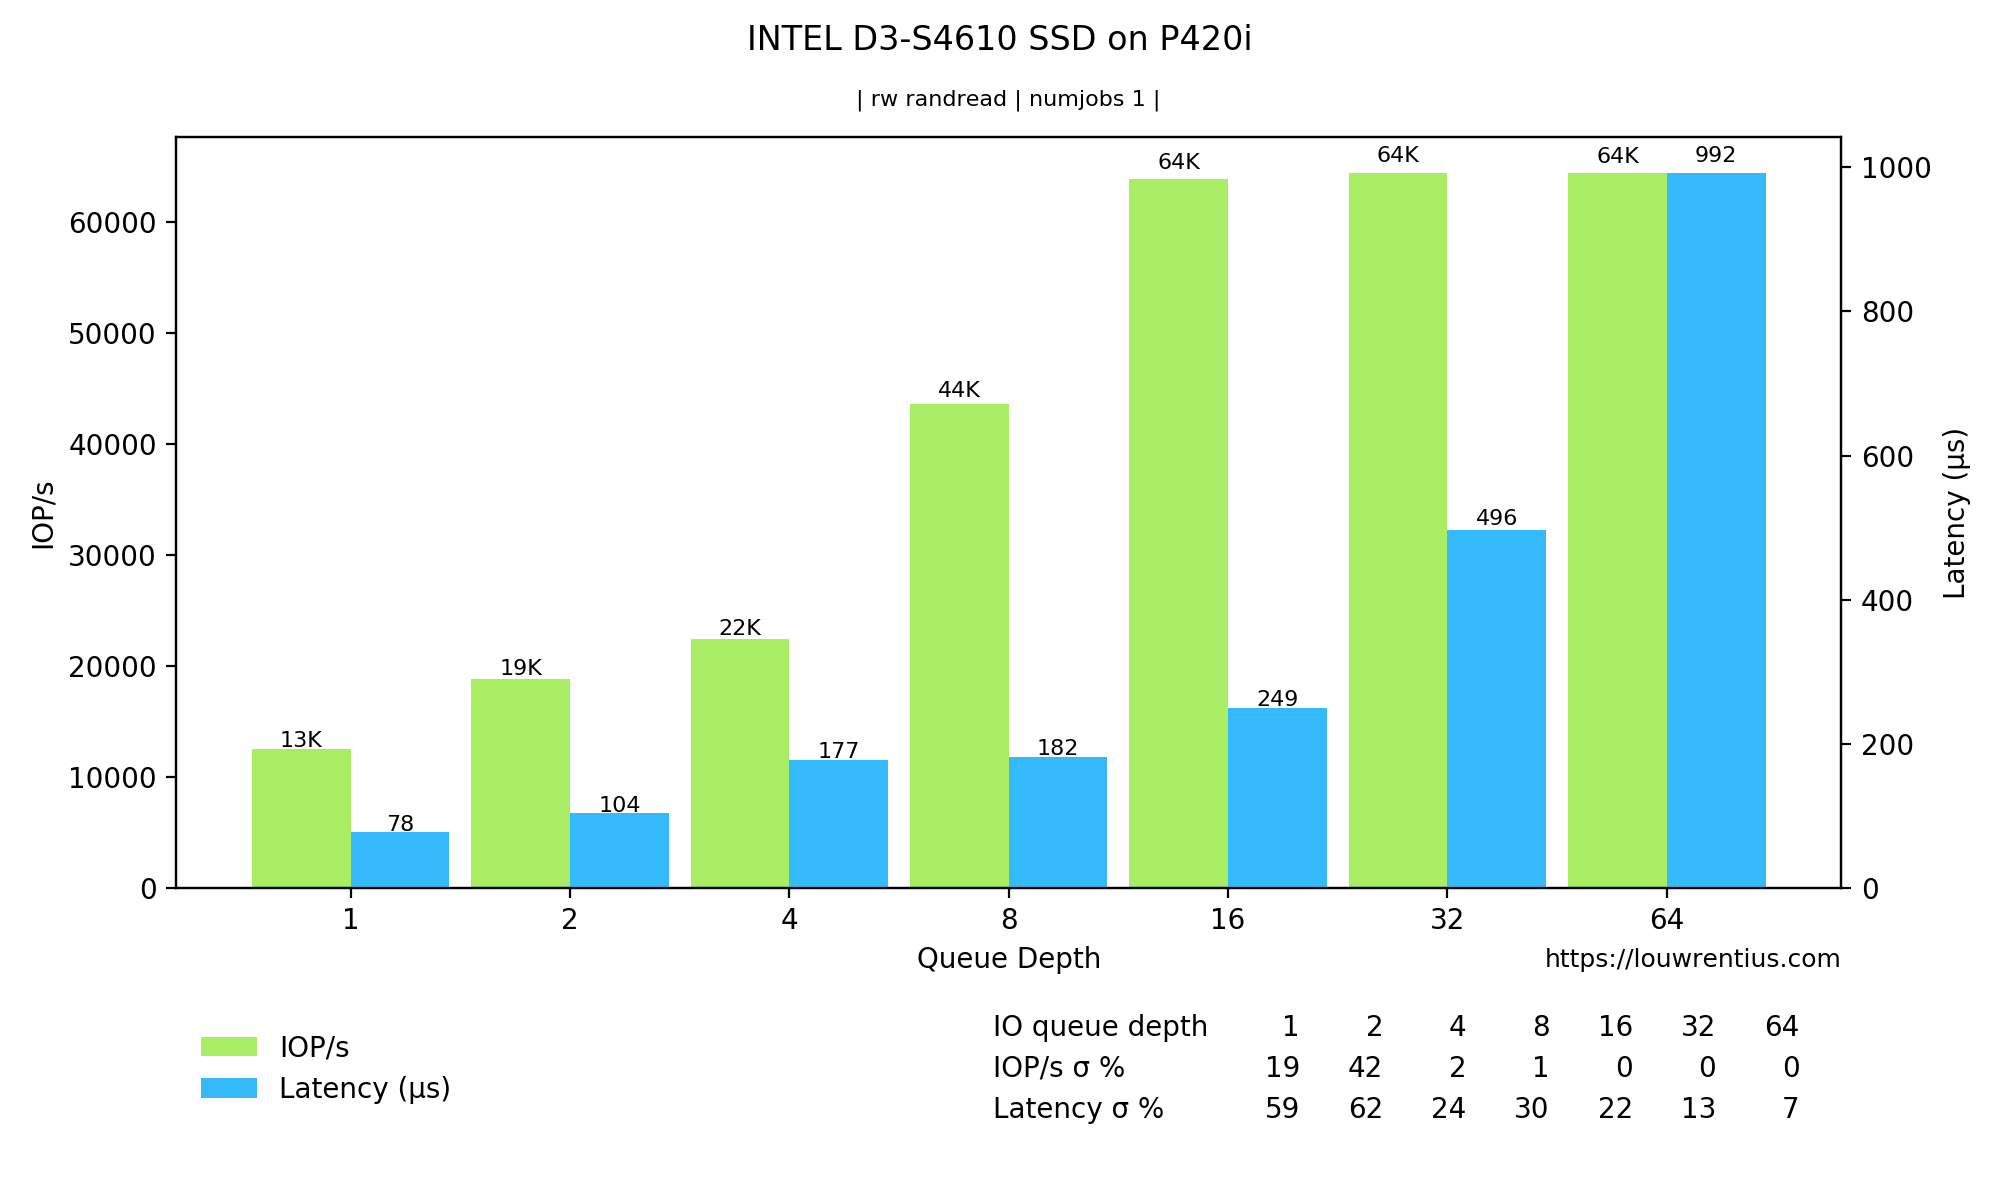
To make graphs of Fio benchmark data, I've created fio-plot. With fio-plot you can generate charts like:
It's very common that you want to run multiple benchmarks with different parameters to compare results. To generate the data of the charts, many benchmarks need to be run. This process needs to be automated.
Automating Fio benchmarks
I've chosen to build my own tool to automate Fio benchmarking. This tool is called bench_fio and is part of fio-plot. I'm aware that - as part of fio - a tool called genfio is provided, to generate fio job files with multiple benchmarks. It's up to you what you want to use. Bench-fio is tailored to output data in a way that aligns with fio-plot.
Bench-fio allows you to benchmark loads with different iodepths, simultaneous jobs, block sizes and other parameters. A benchmark run can consist of hundreds of tests and take many hours.
When you run bench_fio, you can expect output like this:
████████████████████████████████████████████████████
    +++ Fio Benchmark Script +++

Job template:                  fio-job-template.fio
I/O Engine:                    libaio
Number of benchmarks:          98
Estimated duration:            1:38:00
Devices to be tested:          /dev/md0
Test mode (read/write):        randrw
IOdepth to be tested:          1 2 4 8 16 32 64
NumJobs to be tested:          1 2 4 8 16 32 64
Blocksize(s) to be tested:     4k
Time per test (s):             60
Mixed workload (% Read):       75 90

████████████████████████████████████████████████████
4% |█                        | - [0:04:02, 1:35:00]-]
Bench-fio runs real-time and shows the expected remaining time. It also shows all relevant parameters that have been configured for this benchmark run. This makes it easier to spot any mis-configurations.
Notice that this benchmark consists of 98 individual tests: iodepth x NumJobs x Mixed Workload parameters (7 x 7 x 2). With a standard of 60 seconds per benchmark
This is an example of the command-line syntax: :::text ./bench_fio --target /dev/md0 -t device --mode randrw -o RAID_ARRAY --readmix 75 90
More examples can be found here.


