Articles in the Storage category

  1. Difference of Behavior in SATA Solid State Drives

    Wed 29 January 2020

    Introduction


    Update: I've noticed some strange behavior of SSDs when benchmarking them with FIO. After further investigation and additional testing, I've found the reason for the strange patterns in the graphs.

    The 'strange' test results are due to the fact that they were obtained by connecting the SSDs to a P420I controller. As the HBA mode of this controller performs worse than the RAID mode, I used the RAID mode of this controller. Indvidual drives were put in a RAID0 volume. But it turns out that this creates a strange interaction between RAID controller and SSD.

    Additional testing with an SATA 300 AHCI controller shows 'normal' patterns that look similar to the results of the INTEL SSD as compared to the other ones (Samsung and Kingston).

    It seems I've made a mistake by using the P420i controller for testing. I have includes both 'bad' and 'good' results.


    Regular SATA solid state drives may seem interchangeable at this point. They all show amazing IOPS and latency performance.

    I have performed benchmarks on different SSDs from different vendors and it seems that they actually show very different behaviour. This behavior has come to light because I benchmarked the entire device capacity.

    The benchmark - performed with FIO - puts a fifty percent read/write random 4K workload on the device. The benchmark stops when all sectors of the device have been read or written to. Furthermore, all tests are performed with a queue depth of 1.

    I've made this post because I found the results interesting. At least the images show a very peculiar pattern for some SSDs. I can't explain them really, maybe you can.

    This is the test I ran against the SSDs.

    fio --filename=/dev/sdX --direct=1 --rw=randrw --refill_buffers
    --norandommap --ioengine=libaio --bs=4k --rwmixread=50 --iodepth=1
    

    Disclaimer

    I've performed these benchmark to the best of my knowledge. The raw benchmark data is available here

    It's always possible that I made a mistake, so it may be wise to run your own tests to see if you can replicate these results.

    Caveat: I really don't know if these benchmark results impact real-life performance. Maybe these benchmark results show a kind of behaviour of SSDs that doesn't really matter in the end.

    Benchmark Results

    Intel D3-S4610

    This SSD is meant for for datacenter usage. This is the test result on the P420i controller.

    intel

    IOPS and Latency is consistent during the whole benchmark. It's behaviour seems predictable.

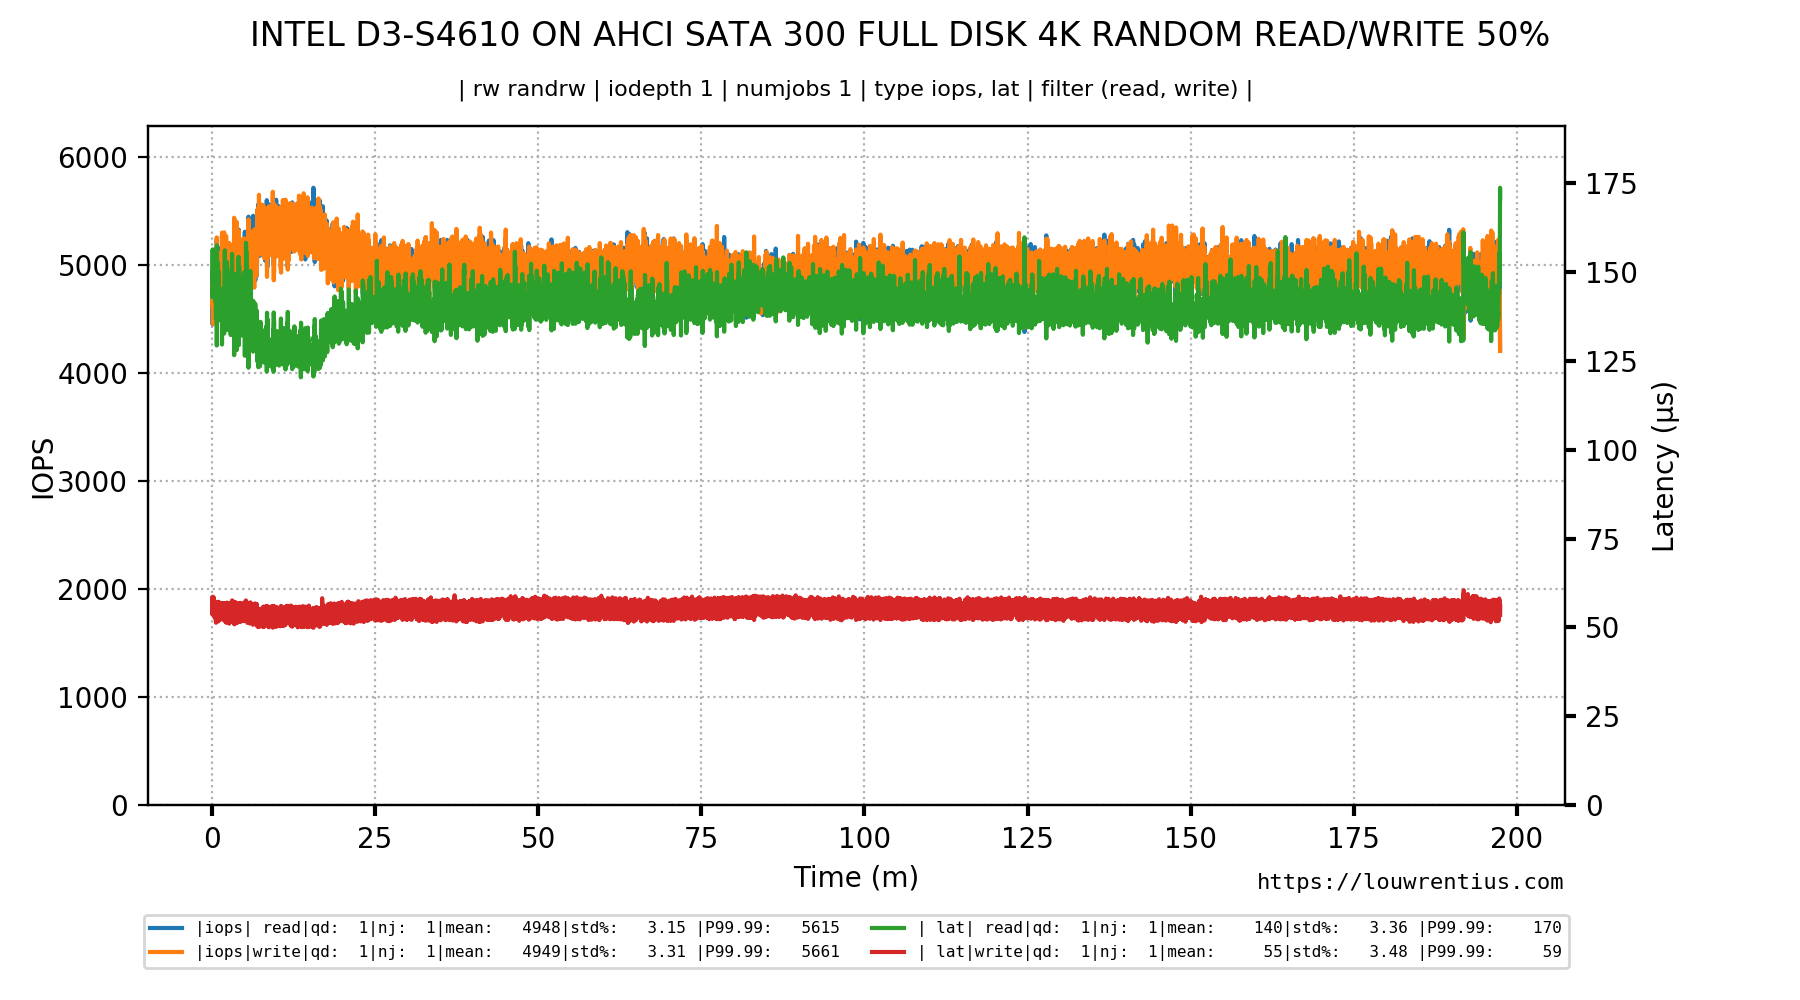
    This is the test result on the AHCI controller:
    intelahci

    Samsung 860 Pro

    This SSD is meant for desktop usage. Its behavior seems quite different from the Intel SSD. I have separated the IOPS data from the Latency data to make the graphs more eligible.

    This is the test result on the P420i controller.

    IOPS

    samsung860iops

    Latency

    samsung860latency

    The best-case latency is almost four times better than the worst-case latency. Latency is thus less predictable. This impact also seems to be reflected in the IOPs numbers.

    This is the test result on the AHCI controller:

    samsung860ahci

    Samsung PM883

    This SSD is meant for datacenter usage. This is the test result on the P420i controller.

    IOPS

    samsungpm883iops

    Latency

    samsungpm883latency

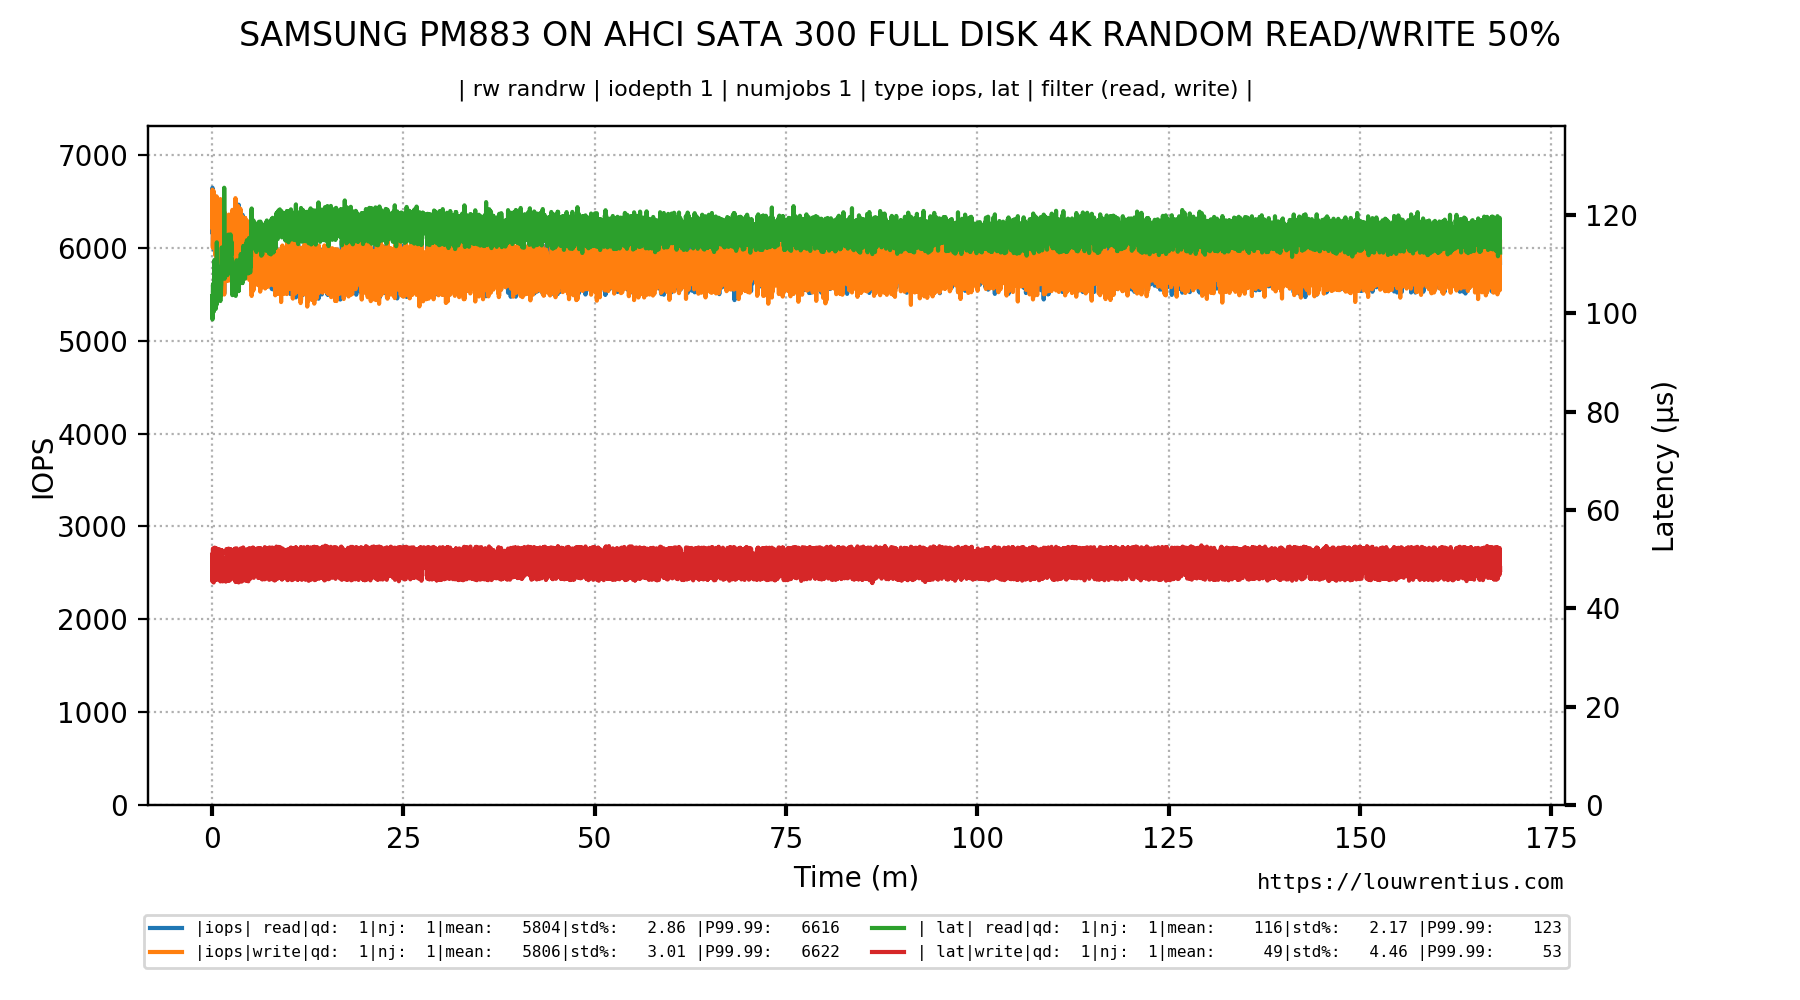
    This SSD seems to behave in a similar way as the 860 PRO.

    This is the test result on the AHCI controller:
    samsungpm8832ahci

    Kingston DC500M

    This SSD is meant for datacenter usage. This is the test result on the P420i controller.

    IOPS

    kingstondc500miops

    latency

    kingstondc500mlatency

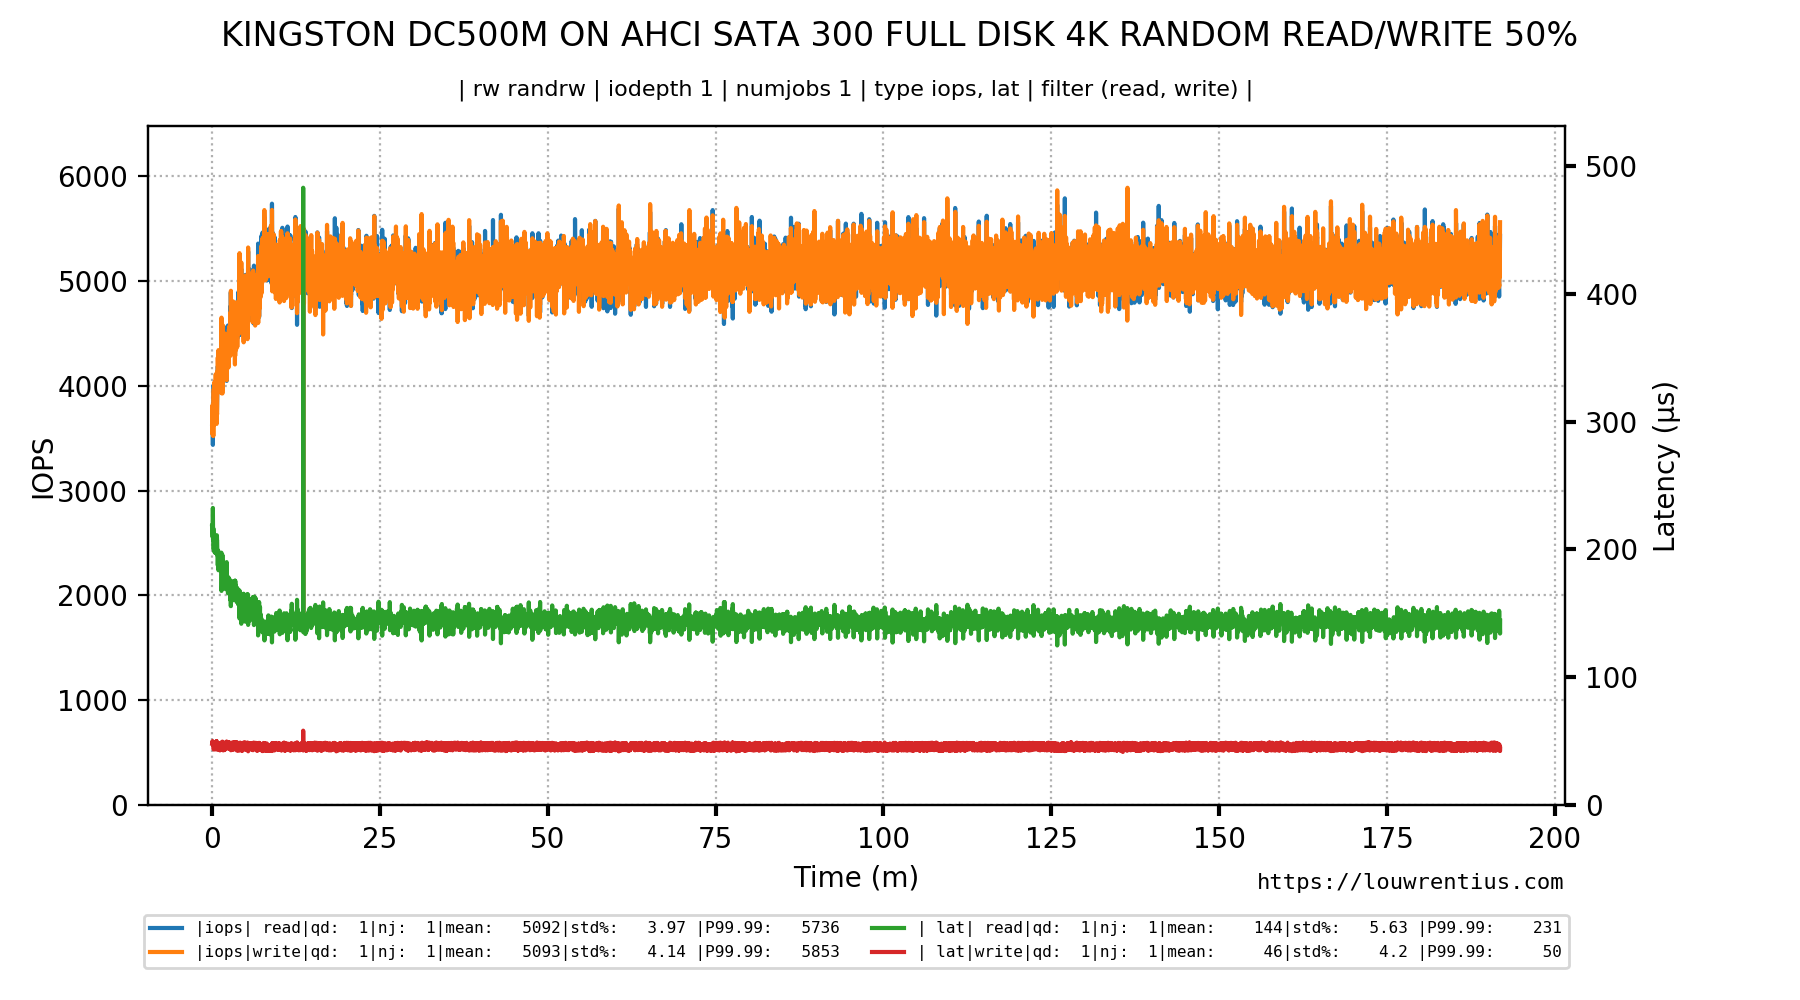
    The behavior of this SSD seems similar to the behaviour of the Samsung SSDs but the pattern is distinct: it seems shifted as compared to the Samsung SSDs.

    This is the test result on the AHCI controller:
    kingstondc500mahci

    Evaluation


    ** Updated evaluation**

    We can conclude that the P420i RAID controller causes strange behavior not observed when we test the SSDs on a regular AHCI controller. Although this was an older SATA 300 controller, I'm making the assumption that this controller still has enough bandwidth to support a random 4K test as most tests never went beyond 50+ MB/s of throughput.


    At this point, I can only say that I observe quite different behavior between the Intel SSD and the other SSDs from Samsung and Kingston. The problem is that I can't tell if this affects real-life day-to-day application performance.

    It seems that although results for the Samsung and Kingston SSDs fluctuate quite a bit, it's quite possible that the fluctuations occur during a very short timespan and effectively cancel each other out.

    If you have comments, ideas or suggestions, leave a comment below.

    How are these images generated?

    All images have been generated with fio-plot.

    The github repository also contains a folder with a lot of example images.
    Tagged as : storage
    If you have any comments email me, see the About page for contact details.
  2. My Ceph Test Cluster Based on Raspberry Pi's and HP MicroServers

    Sun 27 January 2019

    Introduction

    To learn more about Ceph, I've build myself a Ceph Cluster based on actual hardware. In this blogpost I'll discus the cluster in more detail and I've also included (fio) benchmark results.

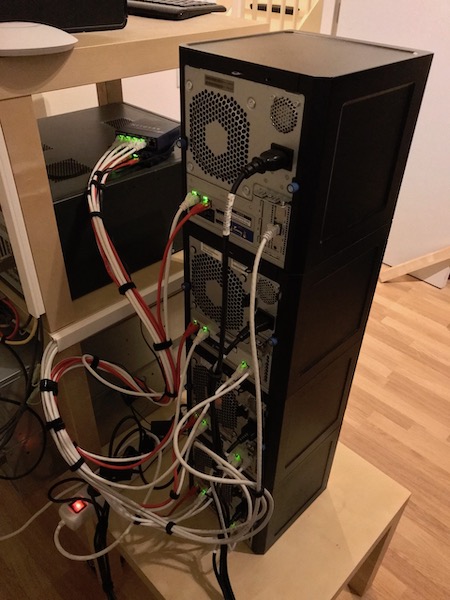
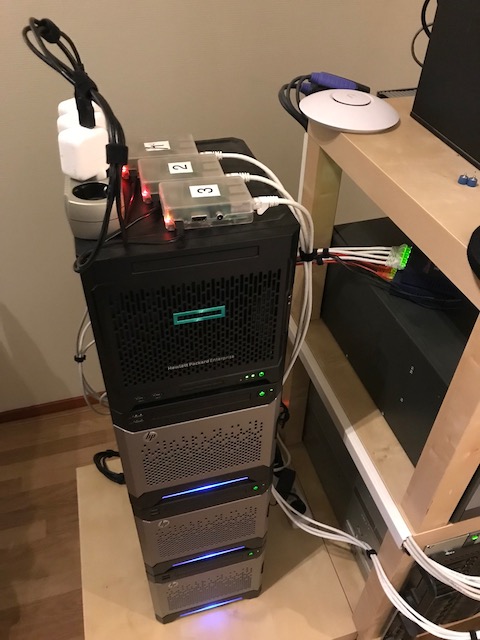
    This is my test Ceph cluster:

    picluster

    The cluster consists of the following components:

     3 x Raspberry Pi 3 Model B+ as Ceph monitors
     4 x HP MicroServer as OSD nodes (3 x Gen8 + 1 x Gen10)
     4 x 4 x 1 TB drives for storage (16 TB raw)
     3 x 1 x 250 GB SSD (750 GB raw)
     2 x 5-port Netgear switches for Ceph backend network (bonding)
    

    Monitors: Raspberry Pi 3 Model B+

    I've done some work getting Ceph compiled on a Raspberry Pi 3 Model B+ running Raspbian. I'm using three Raspberry Pi's as Ceph monitor nodes. The Pi boards don't break a sweat with this small cluster setup.

    Note: Raspberry Pi's are not an ideal choice as a monitor node because Ceph Monitors write data (probably the cluster state) to disk every few seconds. This will wear out the SD card eventually.

    Storage nodes: HP MicroServer

    The storage nodes are based on four HP MicroServers. I really like these small boxes, they are sturdy, contain server-grade components, including ECC-memory and have room for four internal 3.5" hard drives. You can also install 2.5" hard drives or SSDs.

    For more info on the Gen8 and the Gen10 click on their links.

    Unfortunately the Gen8 servers are no longer made. The replacement, the Gen10 model, lacks IPMI/iLO and is also much more expensive (in Europe at least).

    CPU and RAM

    All HP Microservers have a dual-core CPU. The Gen8 servers have 10GB RAM and the Gen10 server has 12GB RAM. I've just added an 8GB ECC memory module to each server, the Gen10 comes with 4GB and the Gen8 came with only 2GB, which explains the difference.

    Boot drive

    The systems all have an (old) internal 2.5" laptop HDD connected to the internal USB 2.0 header using an USB enclosure.

    Ceph OSD HDD

    All servers are fitted with four (old) 1TB 7200 RPM 3.5" hard drives, so the entire cluster contains 16 x 1TB drives.

    Ceph OSD SSD

    There is a fifth SATA connector on the motherboard, meant for an optional optical drive, which I have no use for and wich is not included with the servers.

    I use this SATA connector in the Gen8 MicroServers to attach a Crucial 250GB SSD, which is then tucked away at the top, where the optical drive would sit. So the Gen8 servers have an SSD installed which the Gen10 is lacking.

    The entire cluster thus has 3 x 250GB SSDs installed.

    Networking

    All servers have two 1Gbit network cards on-board and a third one installed in one of the half-height PCIe slots1.

    backside

    The half-height PCIe NICs connect the Microservers to the public network. The internal gigabit NICs are configured in a bond (round-robin) and connected to two 5-port Netgear gigabit switches. This is the cluster network or the backend network Ceph uses for replicating data between the storage nodes.

    You may notice that the first onboard NIC of each server is connected to the top switch and the second one is connected to the bottom switch. This is necessary because linux round-robin bonding requires either separate VLANs for each NIC or in this case separate switches.

    Benchmarks

    Benchmark conditions

    • The tests ran on a physical Ceph client based on an older dual-core CPU and 8GB of RAM. This machine was connected to the cluster with a single gigabit network card.
    • I've mapped RBD block devices from the HDD pool and the SSD pool on this machine for benchmarking.
    • All tests have been performed on the raw /dev/rbd0 device, not on any file or filesystem.
    • The pools use replication with a minimal copy count of 1 and a maximum of 3.
    • All benchmarks have been performed with FIO.
    • All benchmarks used random 4K reads/writes
        NAME     ID     USED        %USED     MAX AVAIL     OBJECTS
        hdd      36     1.47TiB     22.64       5.03TiB      396434
        ssd      38      200GiB     90.92       20.0GiB       51204
    

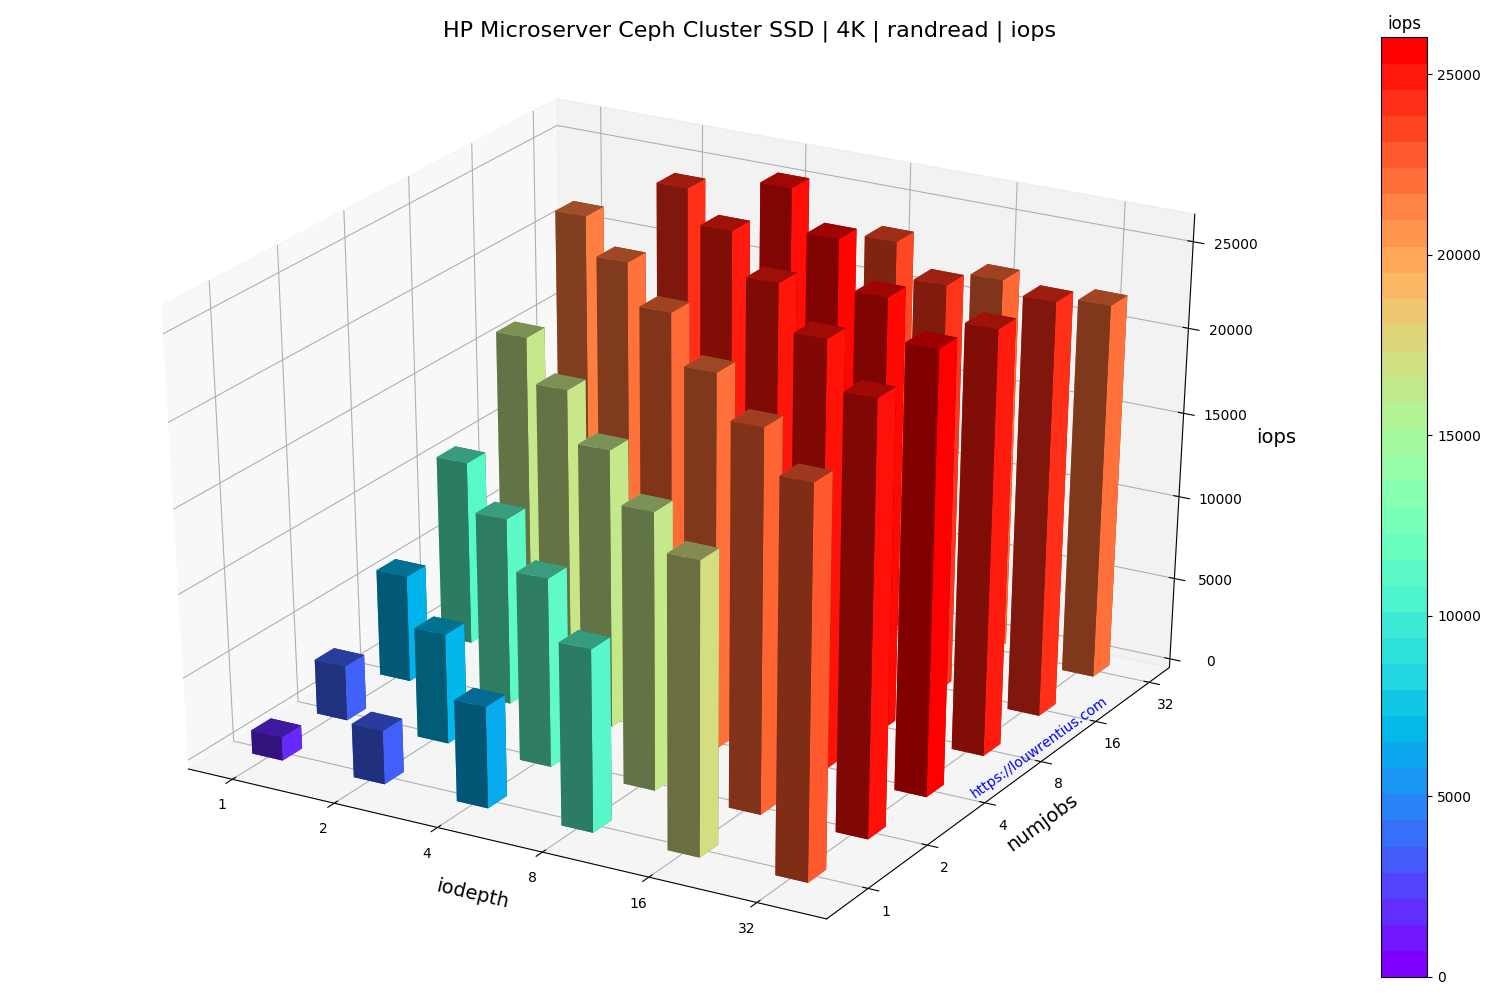
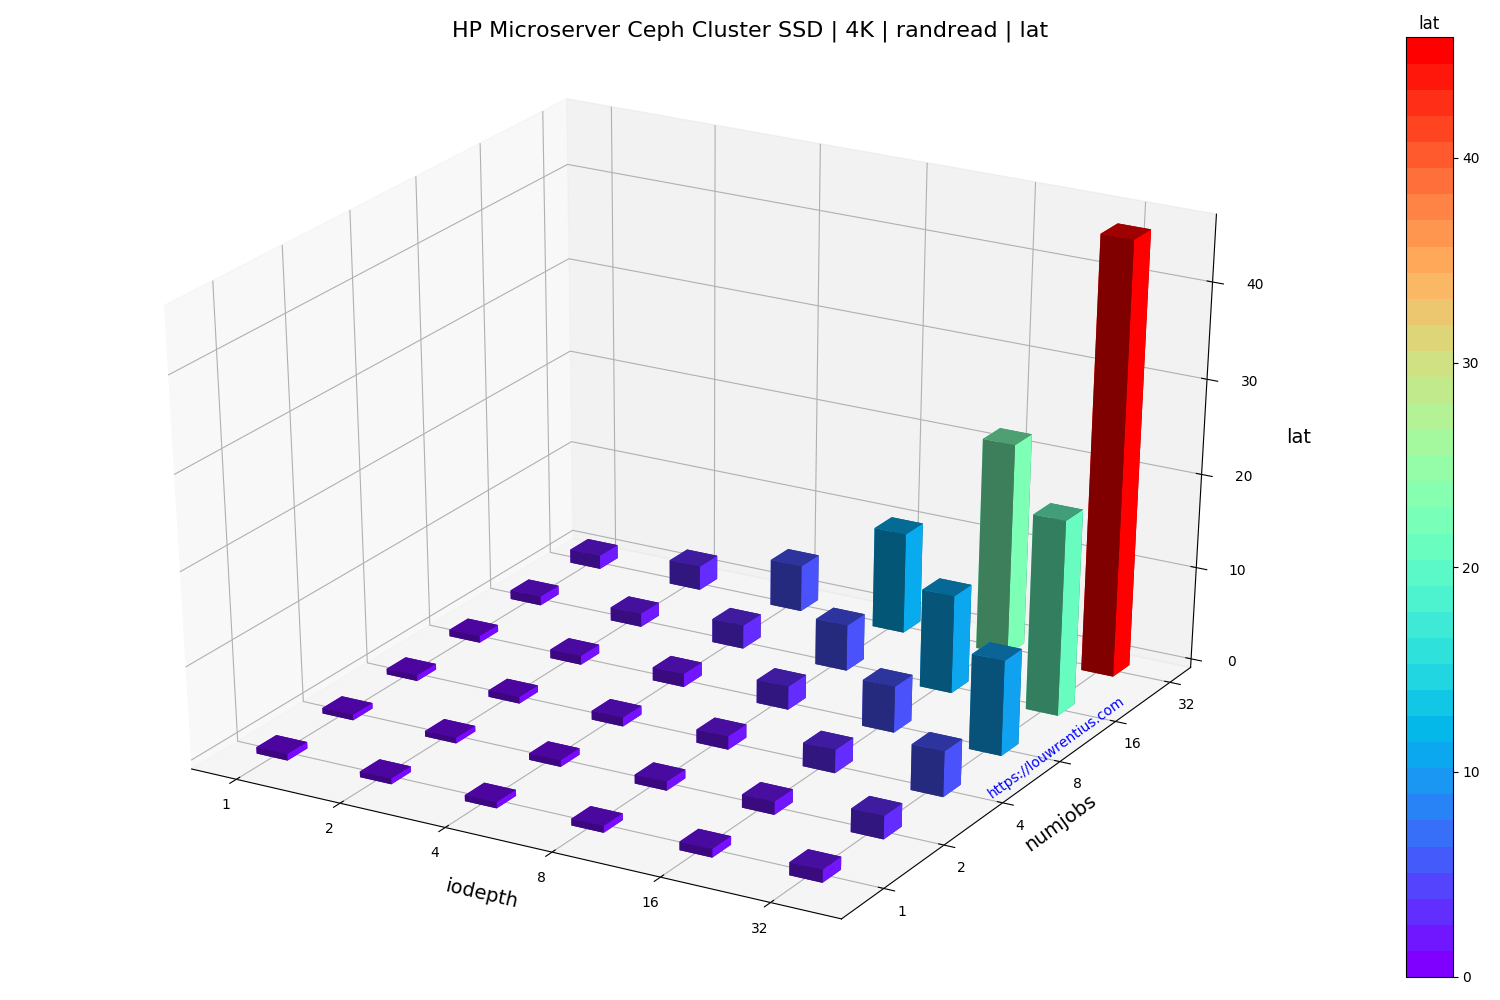
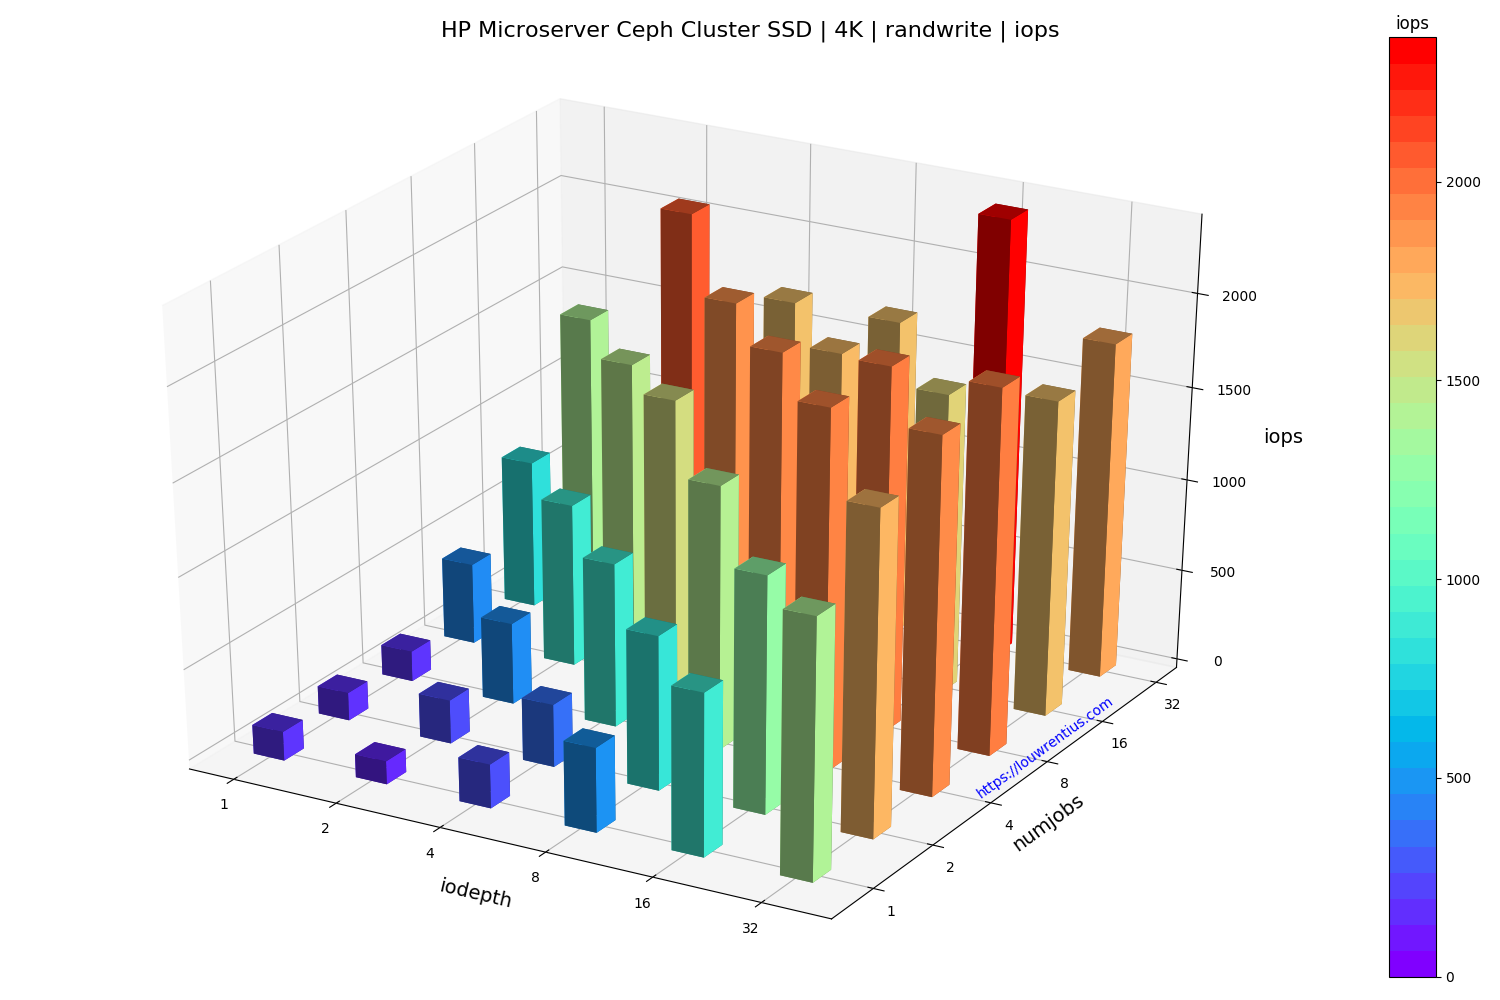
    Benchmark SSD

    Click on the images below to see a larger version.

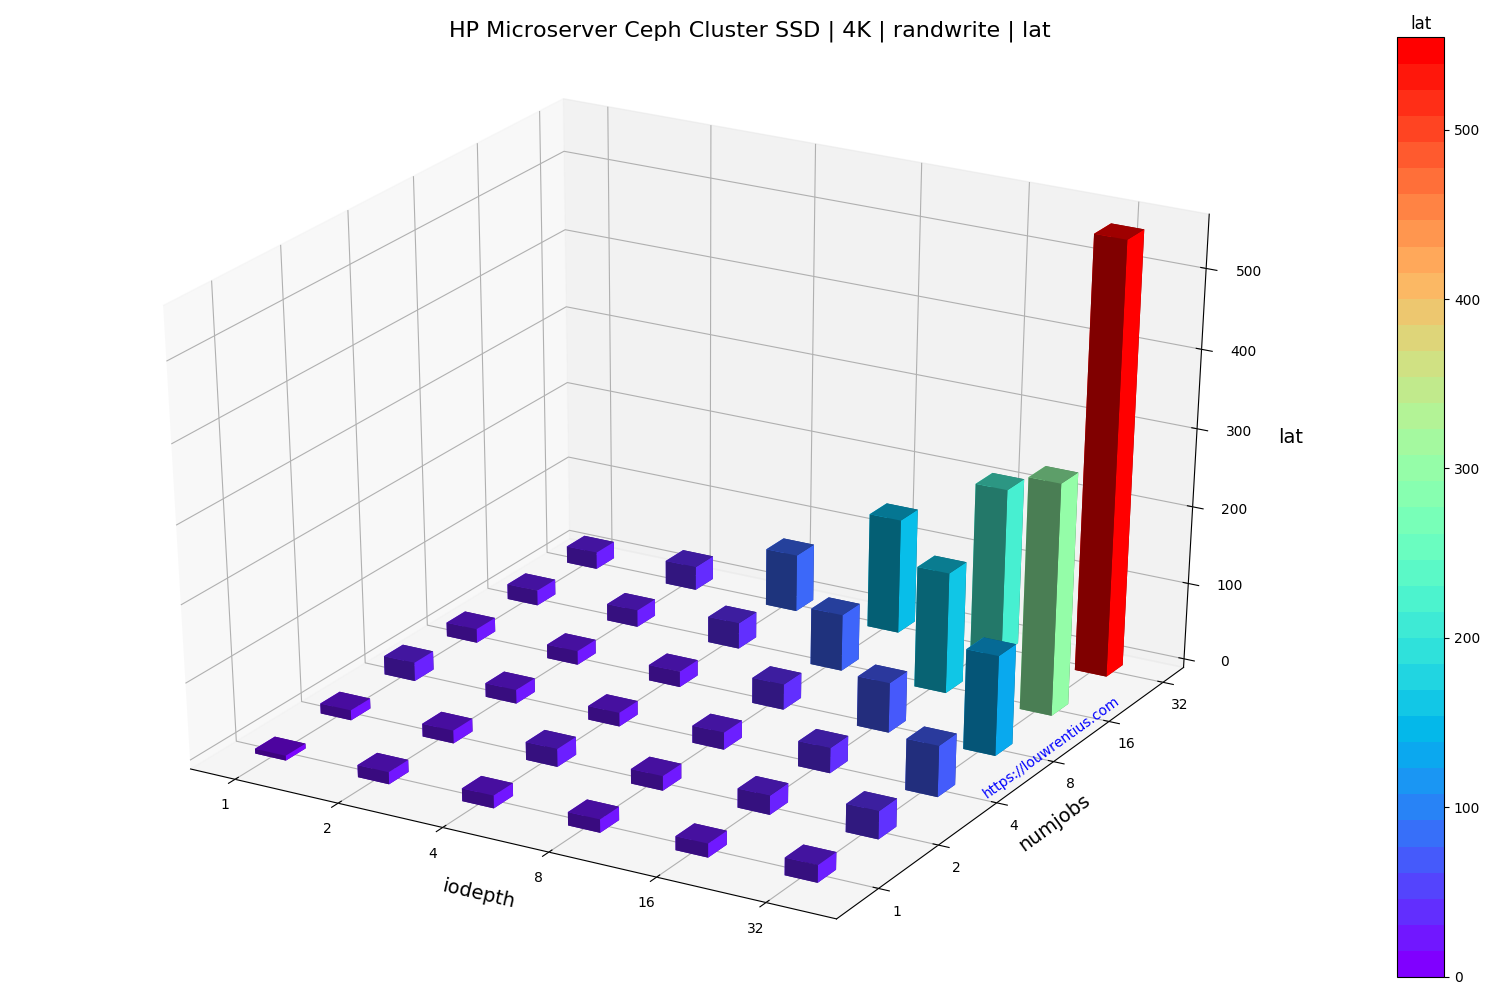
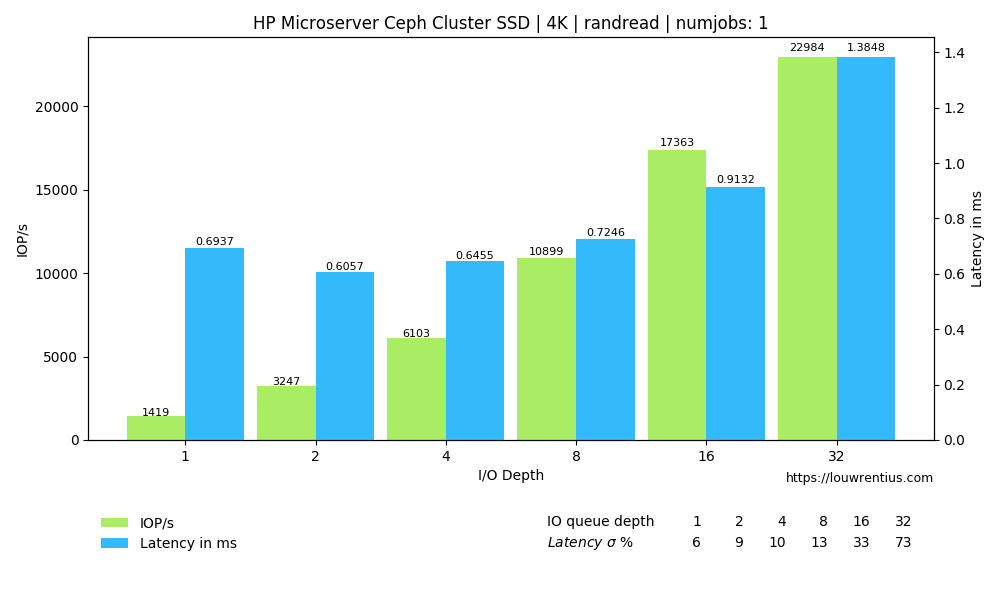
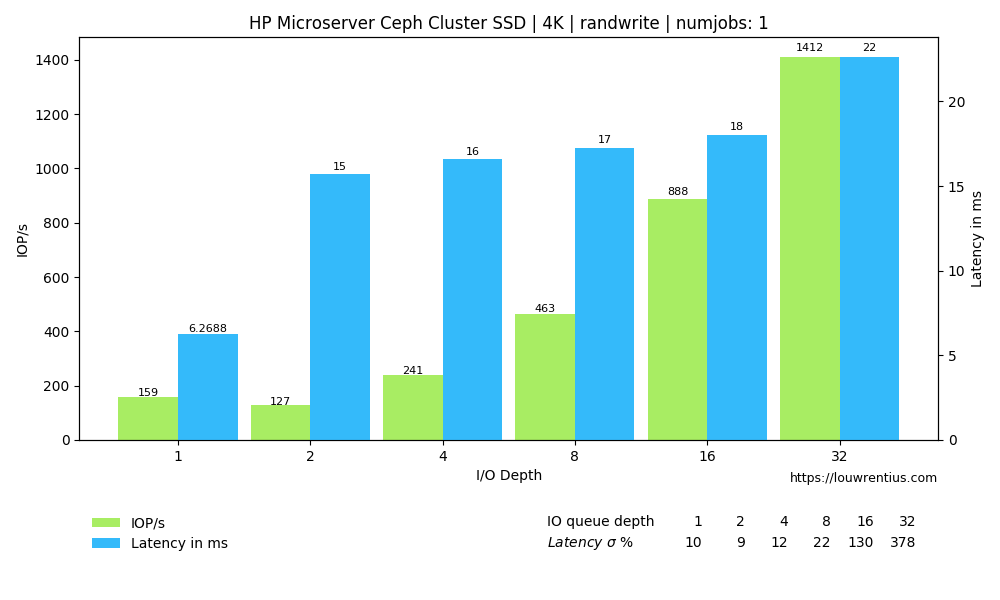
    a b c d e f

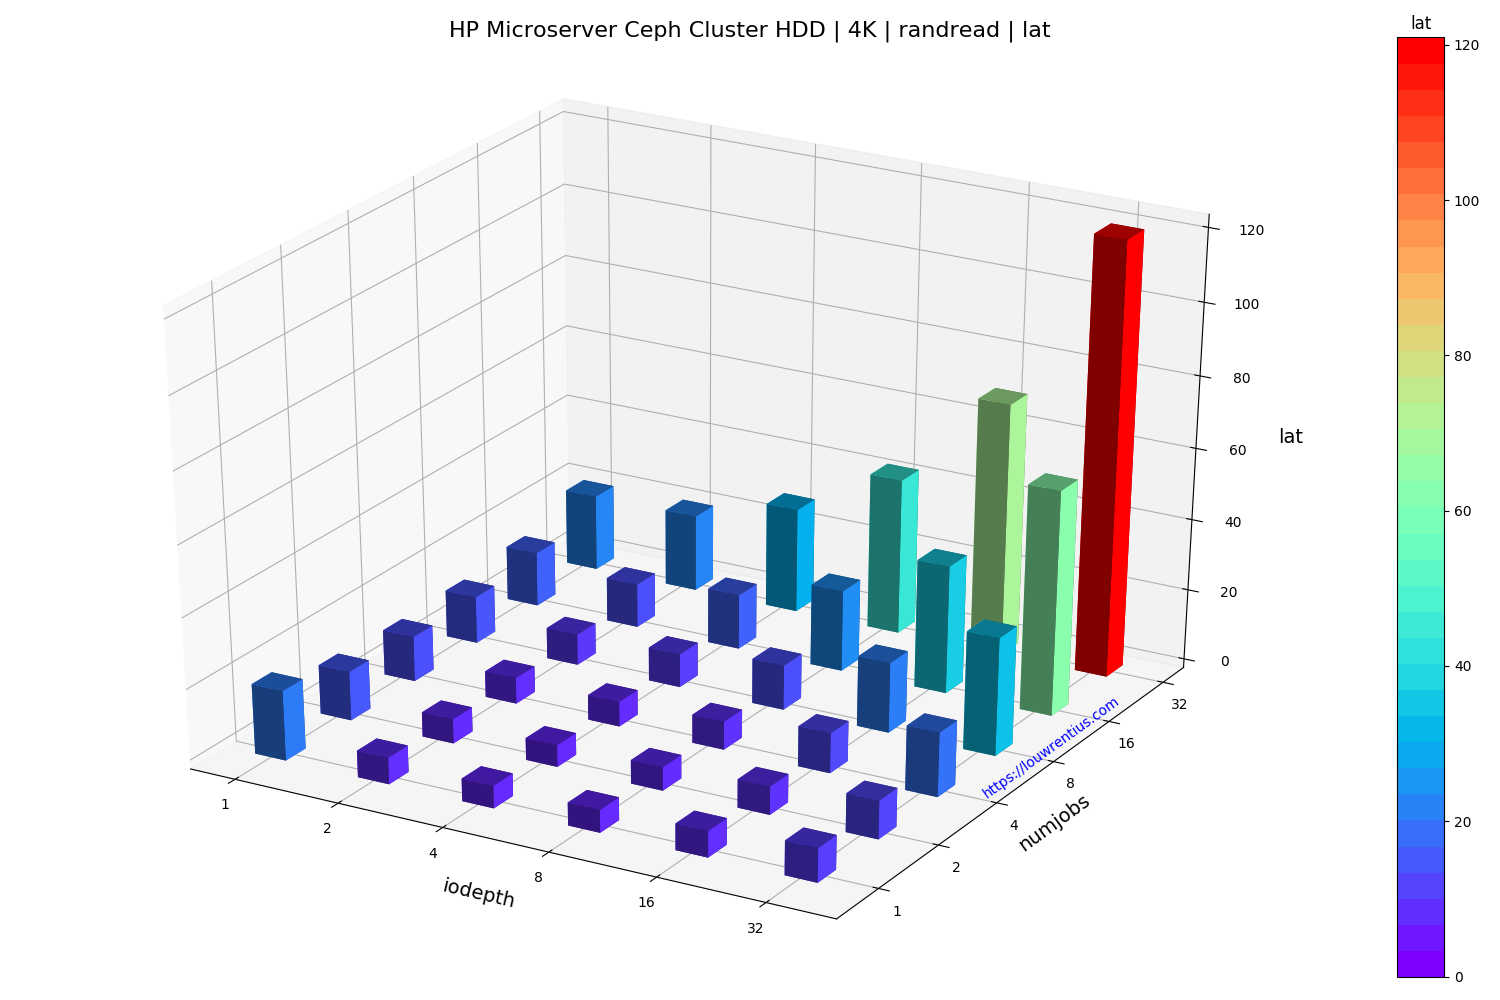
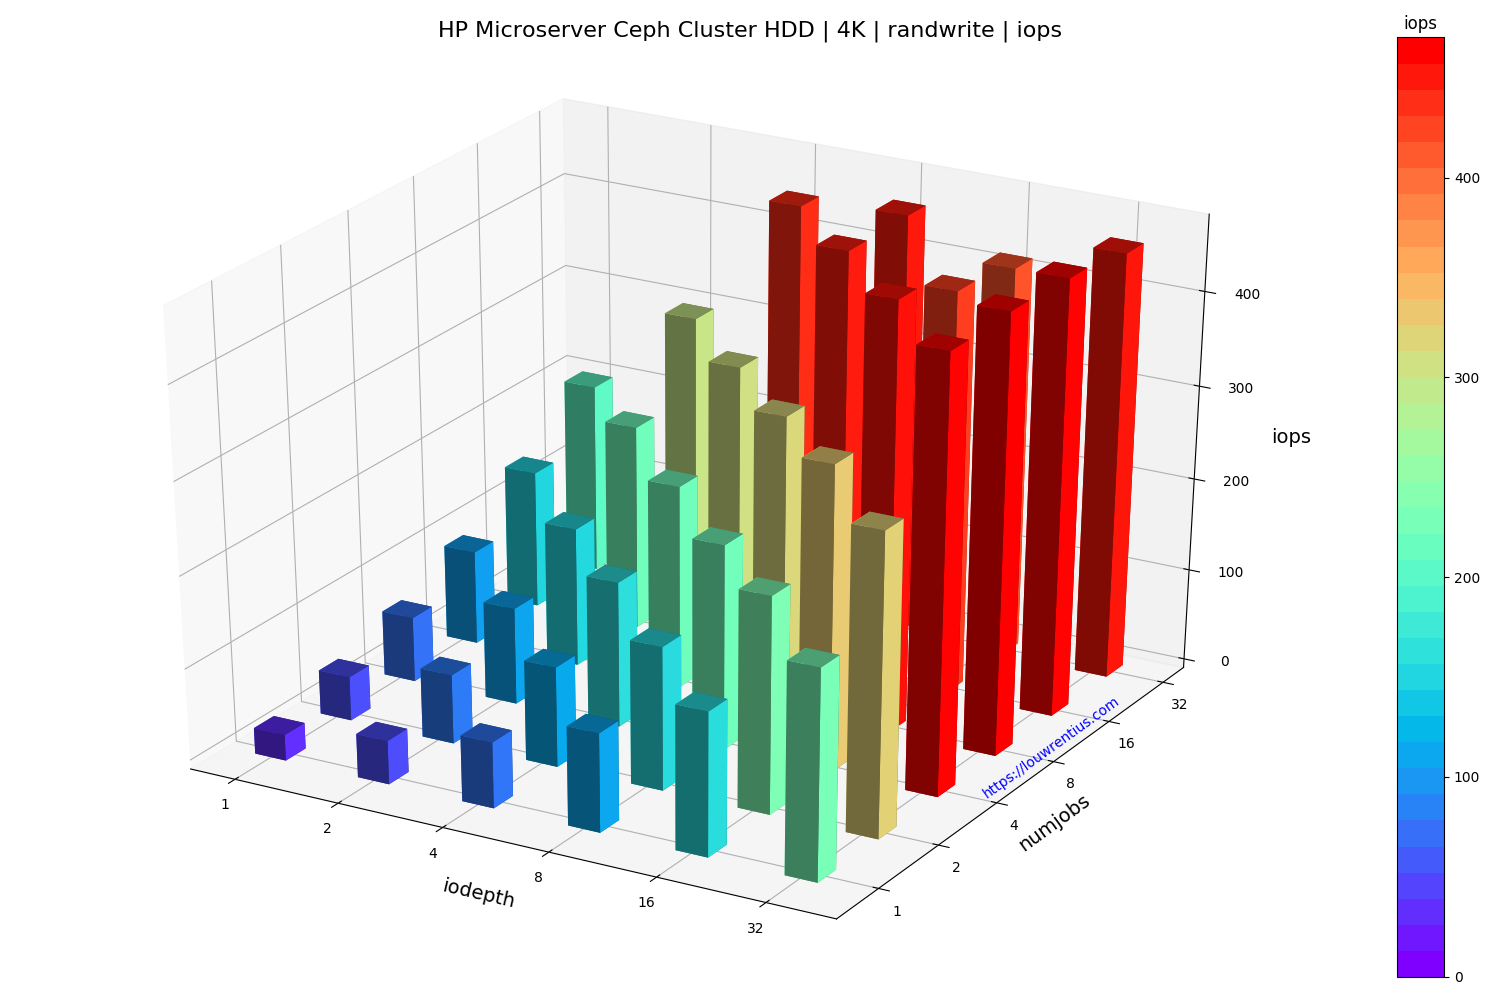
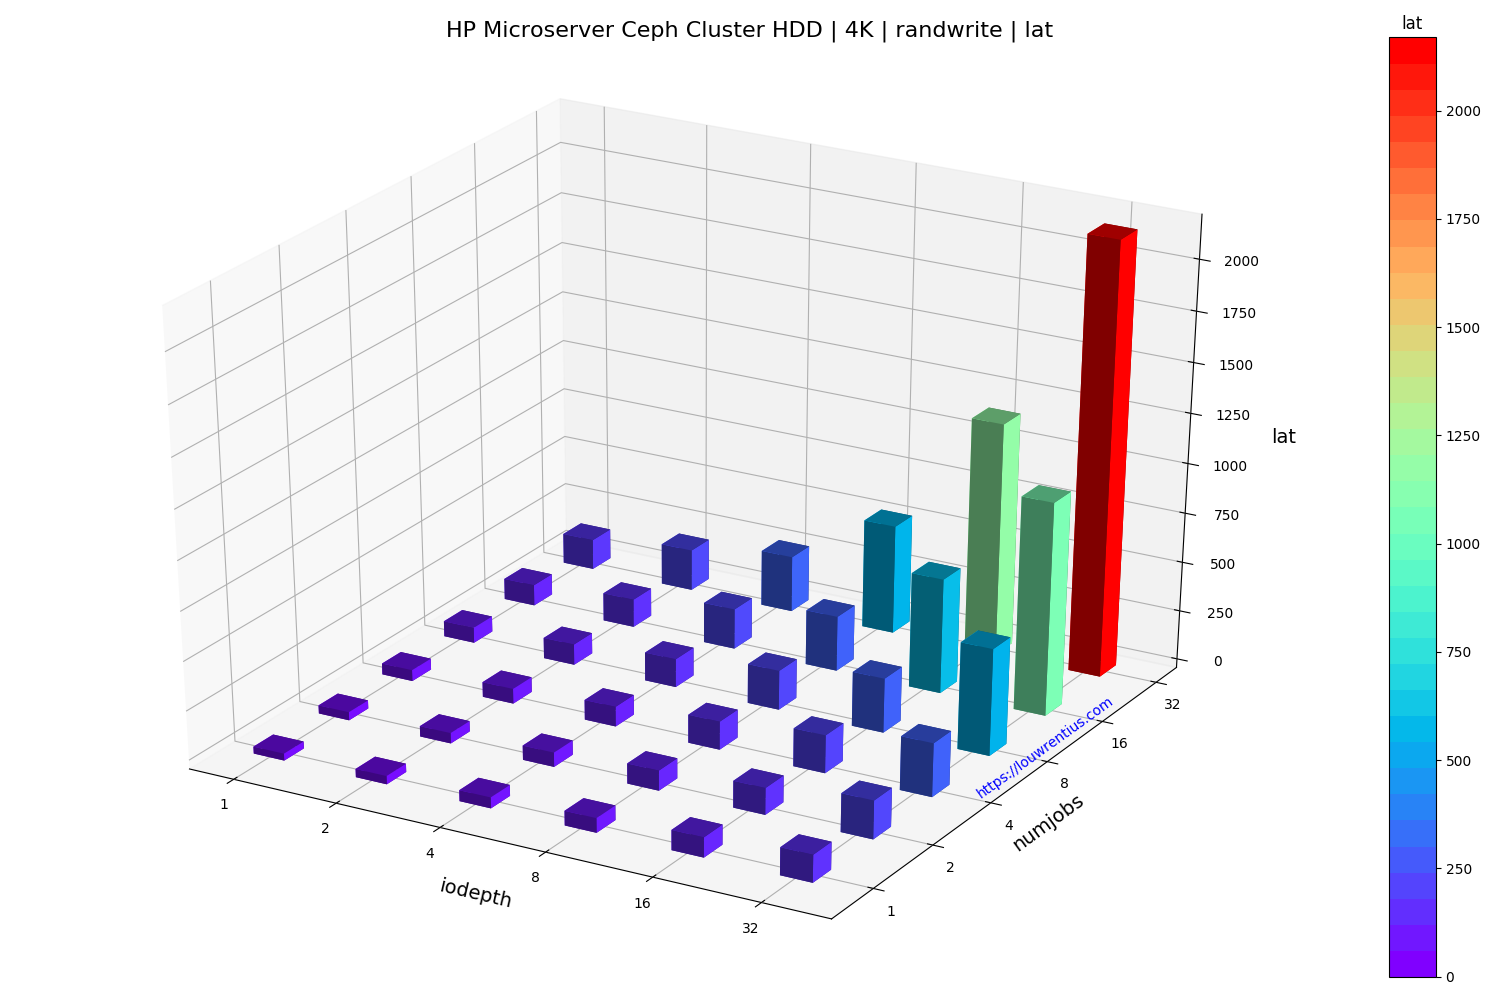
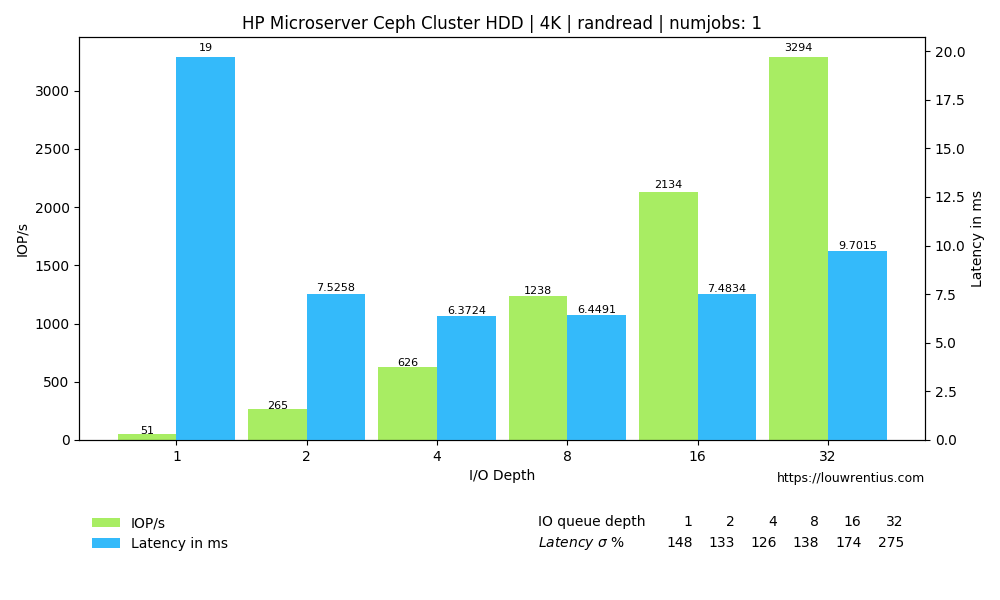
    Benchmark HDD

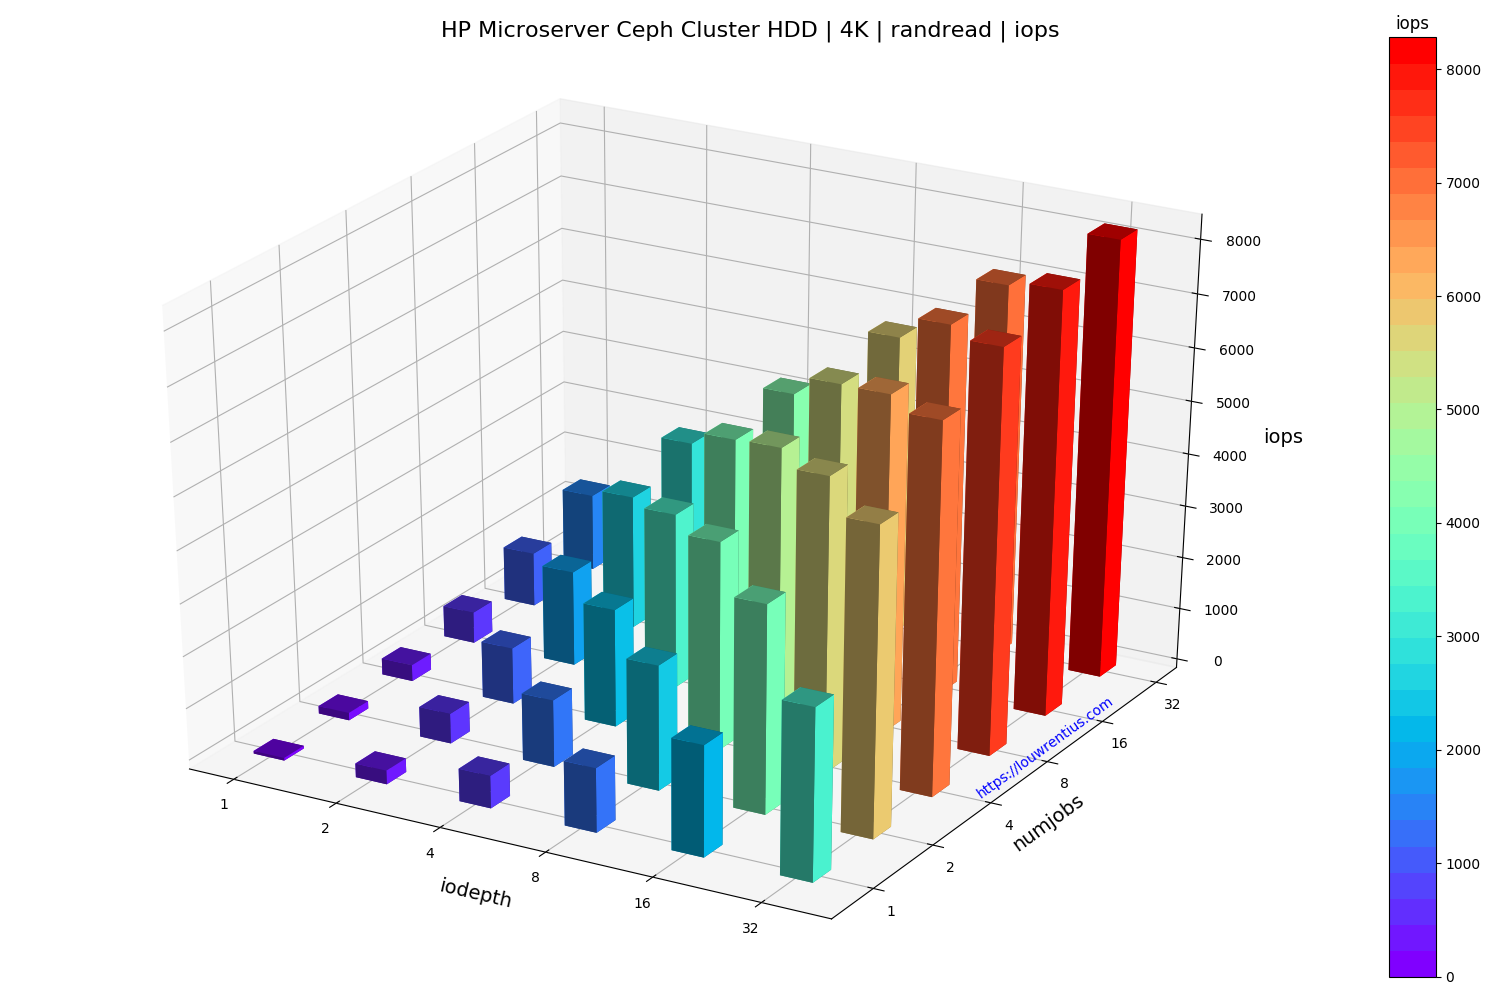
    g h i j k l

    Benchmark evaluation

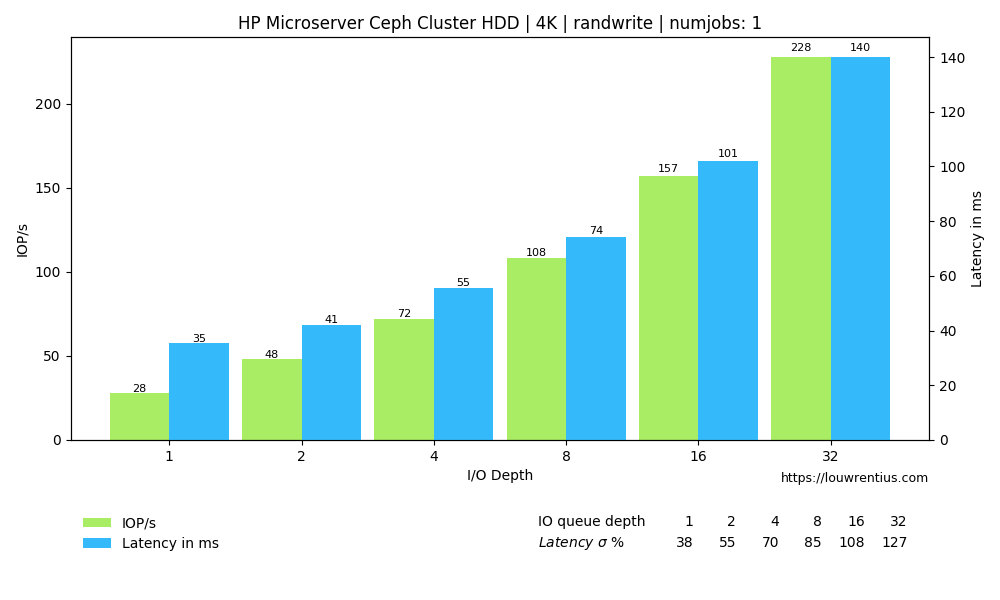
    The random read performance of the hard drives seems unrealistic at higher queue depths and number of simultaneous jobs. This performance cannot be sustained purely on the basis that 16 hard drives with maybe 70 random IOPs each can only sustain 1120 random IOPs.

    I cannot explain why I get these numbers. If anybody has a suggestion, feel free to comment/respond. Maybe the total of 42GB of memory across the cluster may act as some kind of cache.

    Another interesting observation is that a low number of threads and a small IO queue depth results in fairly poor performance, both for SSD and HDD media.

    Especially the performance of the SSD pool is poor with a low IO queue depth. A probable cause is that these SSDs are consumer-grade and don't perform well with low queue depth workloads.

    I find it interesting that even over a single 1Gbit link, the SSD-backed pool is able to sustain 20K+ IOPs at higher queue depths and larger number of threads.

    The small number of storage nodes and the low number of OSDs per node doesn't make this setup ideal but it does seem to perform fairly decent, considering the hardware involved.


    1. You may notice that the Pi's are missing in the picture because this is an older picture when I was running the monitors as virtual machines on hardware not seen in the picture. 

    Tagged as : Ceph
    If you have any comments email me, see the About page for contact details.

Page 5 / 24