When building your own DIY home NAS, it is important that you simulate and test drive failures before you put your important data on it. It makes sense to know what to do in case a drive needs to be replaced. I also recommend putting a substantial amount of data on your NAS and see how long a resilver takes just so you know what to expect.
There are many reports of people building their own (ZFS-based) NAS who found out after a drive failure that resilvering would take days. If your chosen redundancy level for the VDEV would not protect against a second drive failure in the same VDEV (Mirror, RAID-Z) things may get scary. Especially because drives are quite bussy rebuilding data and the extra load on the remaining drives may increase the risk of a second failure.
The chosen RAID level for your VDEV, has an impact on the resilver performance. You may chose to accept lower resilver performance in exchange for additional redundancy (RAID-Z2, RAID-Z3).
I did wonder though how much those resilver times would differ between the various RAID levels. This is why I decided to run some tests to get some numbers.
Test hardware
I've used some test equipment running Debian Jessie + ZFS on Linux. The hardware is rather old and the CPU may have an impact on the results.
CPU : Intel(R) Core(TM)2 Duo CPU     E7400  @ 2.80GHz
RAM : 8 GB
HBA : HighPoint RocketRaid 2340 (each drive in a jbod)
Disk: Samsung Spinpoint F1 - 1 TB - 7200 RPM ( 12 x )
Test method
I've created a script that runs all tests automatically. This is how the script works:
- Create pool + vdev(s).
- Write data on pool ( XX % of pool capacity)
- Replace arbitrary drive with another one.
- Wait for resilver to complete.
- Log resilver duration o csv file.
For each test, I fill the pool up to 25% with data before I measure resilver performance.
Caveats
The problem with the pool only being filled for 25% is that drives are fast at the start, but their performance deteriorates significantly as they fill up. This means that you cannot extrapolate the results and calculate resilver times for 50% or 75% pool usage, the numbers are likely worse than that.
I should run the test again with 50% usage to see if we can demonstrate this effect.
Beware that this test method is probably only suitable for DIY home NAS builds. Production file systems used within businesses may be way more fragmented and I've been told that this could slow down resilver times dramatically.
Test result (lower is better)
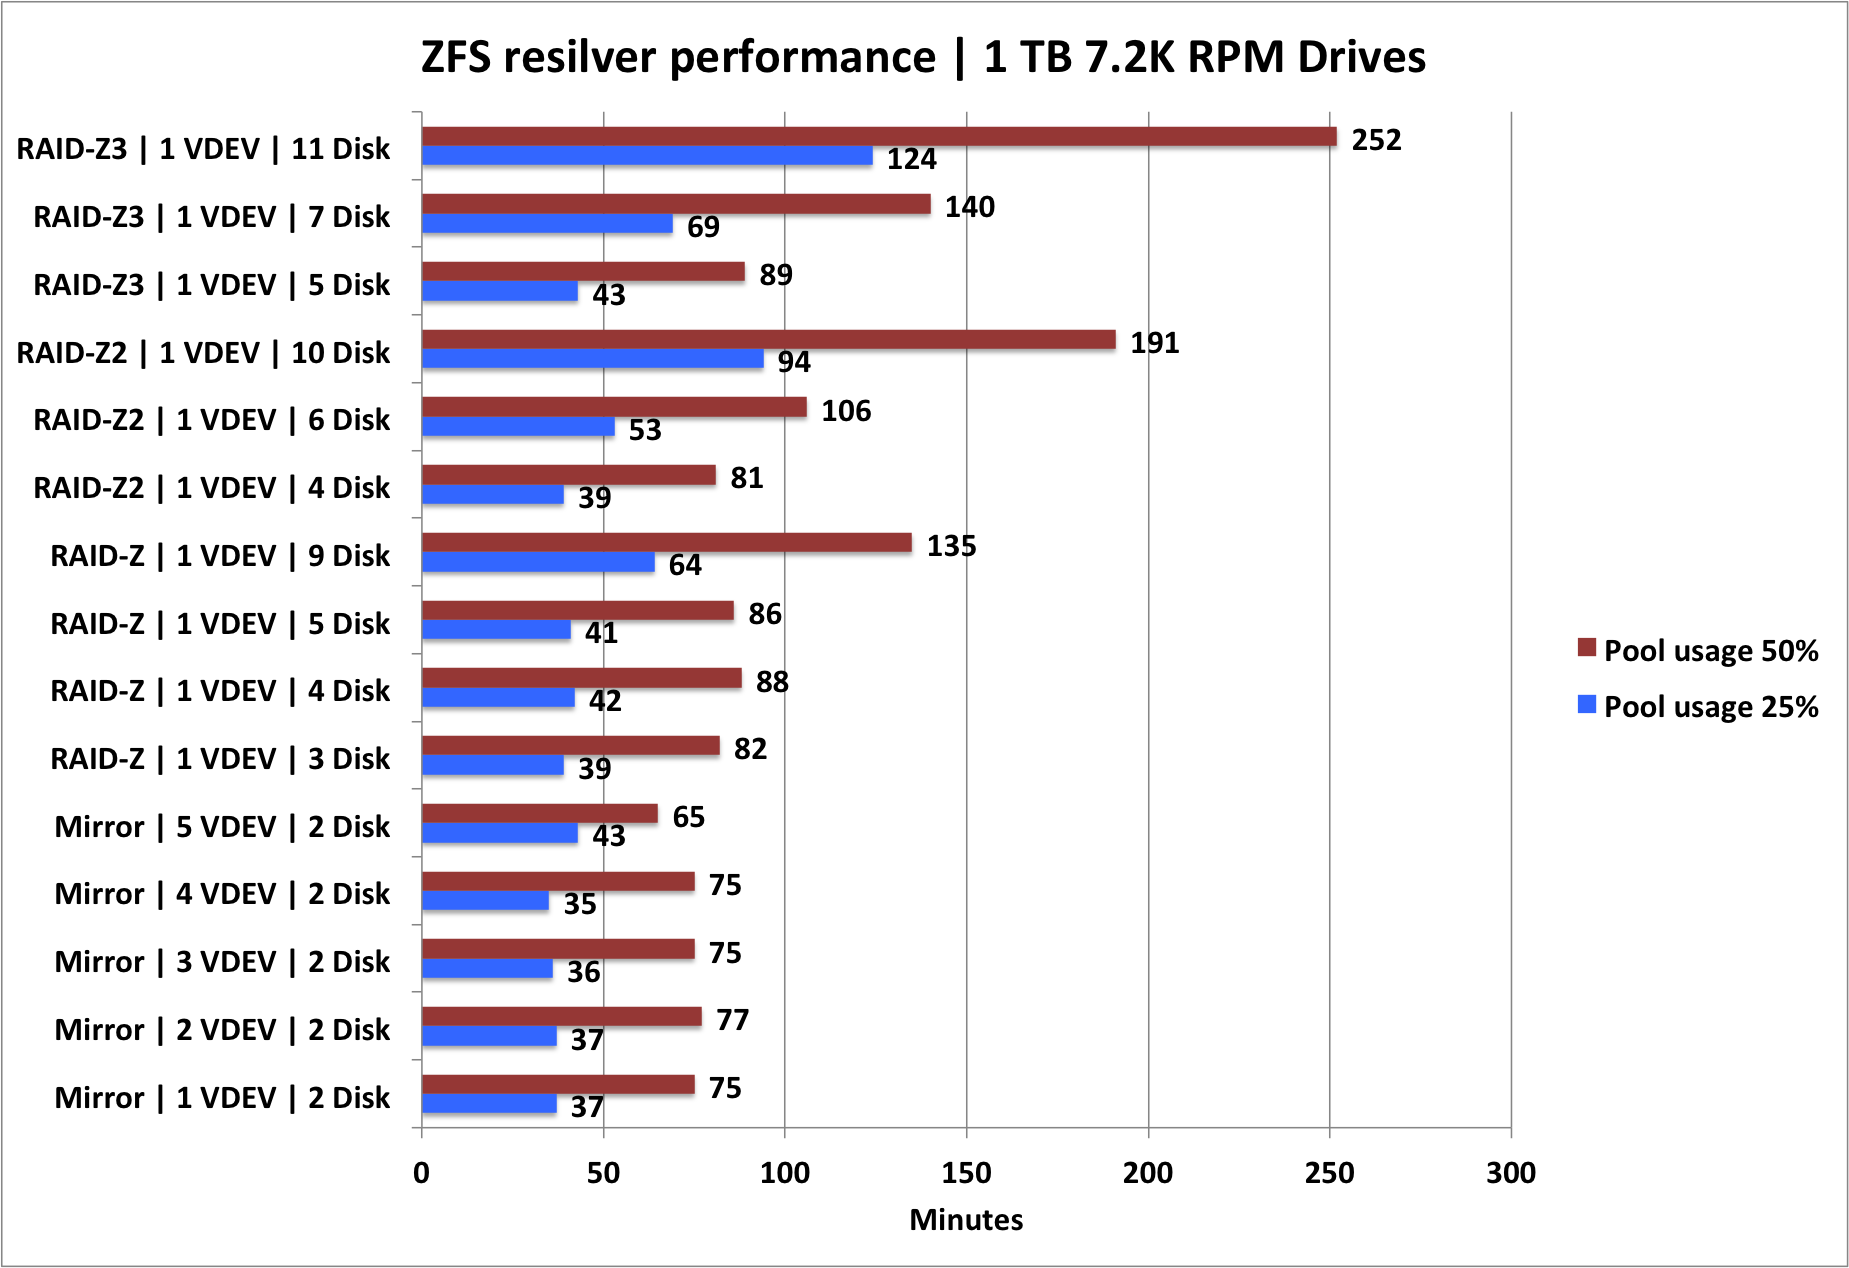
The results can only be used to demonstrate the relative resilver performance differences of the various RAID levels and disk counts per VDEV.
You should not expect the same performance results for your own NAS as the hardware probably differs significantly from my test setup.
Observations
I think the following observations can be made:
- Mirrors resilver the fastest even if the number of drives involved is increased.
- RAID-Z resilver performance is on-par with using mirrors when using 5 disks or less.
- RAID-Zx resilver performance deteriorates as the number of drives in a VDEV increases.
I find it interesting that with smaller number of drives in a RAID-Z VDEV, rebuild performance is roughly on par with a mirror setup. If long rebuild times would scare you away from using RAID-Z, maybe it should not. There may be other reasons why you might shy away from RAID-Z, but this doesn't seem one of them.
RAID-Z2 is often very popular amongst home NAS builders, as it offers a very nice balance between capacity and redundancy. Wider RAID-Z2 VDEVs are more space efficient, but it is also clear that resilver operations take longer. Because RAID-Z2 can tollerate the loss of two drives, I think longer resilver times seem like a reasonable tradeoff.
It is clear that as you put more disks in a single RAID-Zx VDEV, rebuild times increase. This can be used as an argument to keep the number of drives per VDEV 'reasonable' or to switch to RAID-Z3.
25% vs 50% pool usage
To me, there's nothing special to see here. The resilver times are on average slightly worse than double the 25% resilver durations. As disks performance start to deteriorate as they fill up (inner tracks are shorter/slower) sequential performance drops. So this is why I would explain the results are slightly worse than perfect linear scaling.
Final words
I hope this benchmark is of interest to anyone and more importantly, you can run your own by using the aforementioned script. If you ever want to run your own benchmarks, expect the script to run for days. Leave a comment if you have questions or remarks about these test results or the way testing is done.
Comments